#ACE/USDT LONG#ACE
The price is moving in a descending channel on the 1-hour timeframe. It has reached the lower boundary and is heading towards breaking above it, with a retest of the upper boundary expected.
We have a downtrend on the RSI indicator, which has reached near the lower boundary, and an upward reb
Related pairs

ACE/USDT - Trend Reversal ACE/USDT is currently trading inside a key zone between 0.20–0.25$, where strong buyers are actively accumulating. Repeated defenses of this area indicate that smart money is stepping in and absorbing sell pressure, a behavior typically seen near macro bottoms.

ACEUSDT 12H#ACE is trading above the SMA100 and has broken out above the descending resistance on the 12H timeframe. The upside targets are:
🎯 $0.332
🎯 $0.374
🎯 $0.415
🎯 $0.474
🎯 $0.550
⚠️ Always remember to use a tight stop-loss and maintain proper risk management.

ACEUSDT UPDATE#ACE
UPDATE
ACE Technical Setup
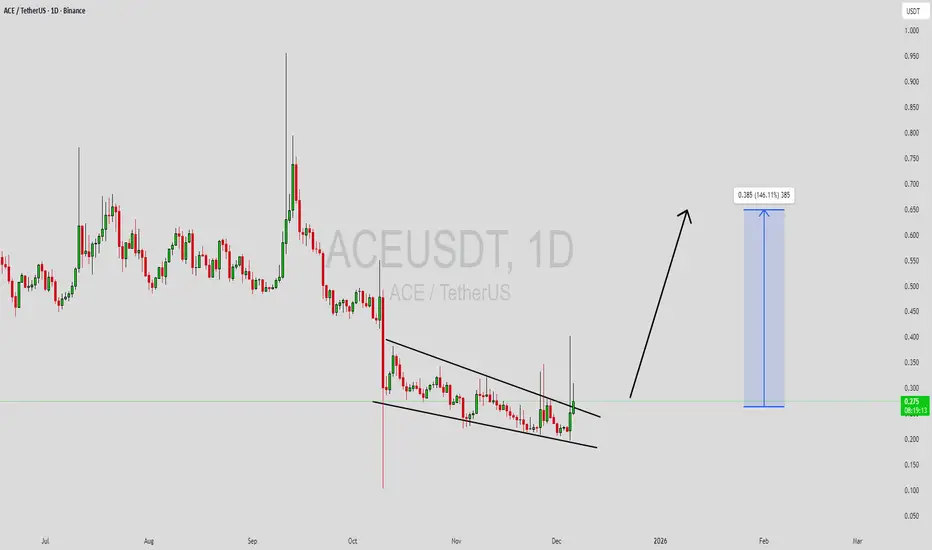
Pattern: Falling Wedge Pattern
Current Price: $0.292
Target Price: $0.361
Target % Gain: 138.99%
Technical Analysis: ACE is breaking out of a falling wedge pattern on the 1D chart, signaling bullish potential. The price has recently surged above the resistance

ACEUSDT Forming Falling WedgeACEUSDT is forming a clear falling wedge pattern, a classic bullish reversal signal that often indicates an upcoming breakout. The price has been consolidating within a narrowing range, suggesting that selling pressure is weakening while buyers are beginning to regain control. With consistent volume

Bullish DivergenceACEUSDT
CMP 0.260 (09-12-2025)
Bullish Divergence appearing on bigger tf.
It may touch 2 & then 3.40
Stoploss should be 0.103

ACEUSDT Forming Falling WedgeACEUSDT is forming a clear falling wedge pattern, a classic bullish reversal signal that often indicates an upcoming breakout. The price has been consolidating within a narrowing range, suggesting that selling pressure is weakening while buyers are beginning to regain control. With consistent volume
ACE/USDT — Accumulation Zone! Bulls for a Major Reversal?ACE is currently trading above its key demand zone between 0.416 and 0.479 USDT — an area that has consistently absorbed selling pressure throughout 2025.
Each touch of this yellow zone has produced a strong rebound and long lower wicks, signaling aggressive accumulation by buyers or larger market p
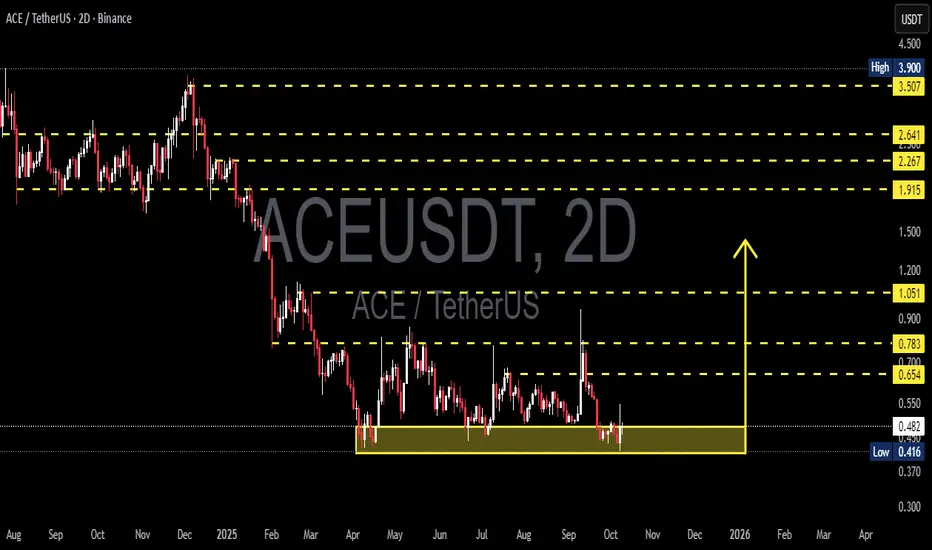
ACEUSDT 1D#ACE is moving inside a rectangle on the daily chart. We can be bullish only if it can hold the price above the rectangle support line. The potential targets are:
🎯 $0.671
🎯 $0.802
🎯 $0.946
🎯 $1.070
🎯 $1.245
🎯 $1.468
⚠️ Always remember to use a tight stop-loss and follow proper risk management.

ACE ANALYSIS🔮#ACE Analysis 💰💰
#ACE is trading in a symmetrical triangle in a weekly time frame and breakouts with high volume and we could see a bullish momentum in #ACE. Before that we will see little bit retest and then bullish movement
🔖 Current Price: $0.5745
⏳ Target Price: $0.8548
⁉️ What to do?
-

See all ideas
Summarizing what the indicators are suggesting.
Oscillators
Neutral
SellBuy
Strong sellStrong buy
Strong sellSellNeutralBuyStrong buy
Oscillators
Neutral
SellBuy
Strong sellStrong buy
Strong sellSellNeutralBuyStrong buy
Summary
Neutral
SellBuy
Strong sellStrong buy
Strong sellSellNeutralBuyStrong buy
Summary
Neutral
SellBuy
Strong sellStrong buy
Strong sellSellNeutralBuyStrong buy
Summary
Neutral
SellBuy
Strong sellStrong buy
Strong sellSellNeutralBuyStrong buy
Moving Averages
Neutral
SellBuy
Strong sellStrong buy
Strong sellSellNeutralBuyStrong buy
Moving Averages
Neutral
SellBuy
Strong sellStrong buy
Strong sellSellNeutralBuyStrong buy
Displays a symbol's price movements over previous years to identify recurring trends.
Frequently Asked Questions
The current price of ACE / TetherUS (ACE) is 0.283 USDT — it has fallen −2.09% in the past 24 hours. Try placing this info into the context by checking out what coins are also gaining and losing at the moment and seeing ACE price chart.
ACE / TetherUS price has risen by 0.72% over the last week, its month performance shows a 11.95% increase, and as for the last year, ACE / TetherUS has decreased by −87.33%. See more dynamics on ACE price chart.
Keep track of coins' changes with our Crypto Coins Heatmap.
Keep track of coins' changes with our Crypto Coins Heatmap.
ACE / TetherUS (ACE) reached its highest price on Dec 21, 2023 — it amounted to 17.250 USDT. Find more insights on the ACE price chart.
See the list of crypto gainers and choose what best fits your strategy.
See the list of crypto gainers and choose what best fits your strategy.
ACE / TetherUS (ACE) reached the lowest price of 0.103 USDT on Oct 10, 2025. View more ACE / TetherUS dynamics on the price chart.
See the list of crypto losers to find unexpected opportunities.
See the list of crypto losers to find unexpected opportunities.
The safest choice when buying ACE is to go to a well-known crypto exchange. Some of the popular names are Binance, Coinbase, Kraken. But you'll have to find a reliable broker and create an account first. You can trade ACE right from TradingView charts — just choose a broker and connect to your account.
Crypto markets are famous for their volatility, so one should study all the available stats before adding crypto assets to their portfolio. Very often it's technical analysis that comes in handy. We prepared technical ratings for ACE / TetherUS (ACE): today its technical analysis shows the buy signal, and according to the 1 week rating ACE shows the sell signal. And you'd better dig deeper and study 1 month rating too — it's neutral. Find inspiration in ACE / TetherUS trading ideas and keep track of what's moving crypto markets with our crypto news feed.
ACE / TetherUS (ACE) is just as reliable as any other crypto asset — this corner of the world market is highly volatile. Today, for instance, ACE / TetherUS is estimated as 2.91% volatile. The only thing it means is that you must prepare and examine all available information before making a decision. And if you're not sure about ACE / TetherUS, you can find more inspiration in our curated watchlists.
You can discuss ACE / TetherUS (ACE) with other users in our public chats, Minds or in the comments to Ideas.