Nasdaq November RED candle and then continue movement.Due since april we have monthly 7 green candles, we need a reversal and red candle in November to continue then the movement to 27,000. But first a back movement to 25,000 and triangle pattern could be the movement for november.
Trade ideas
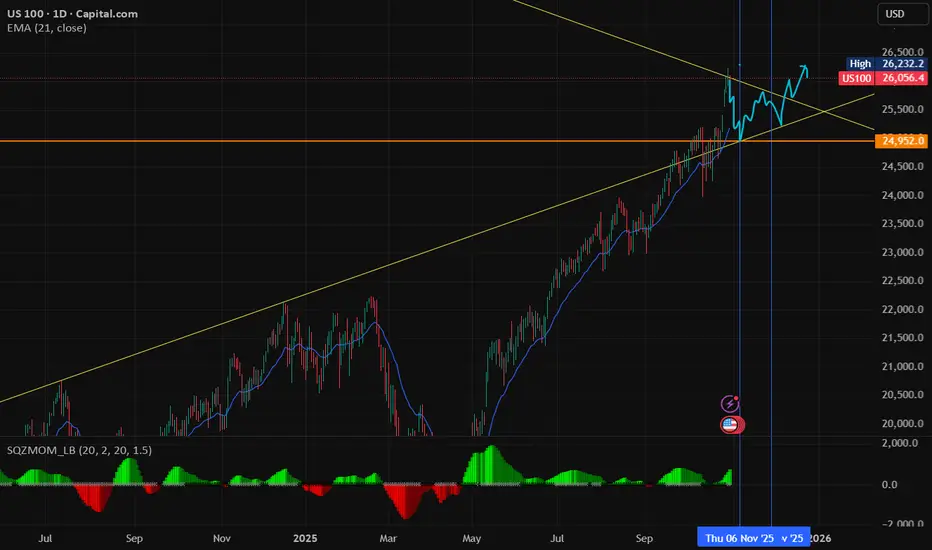
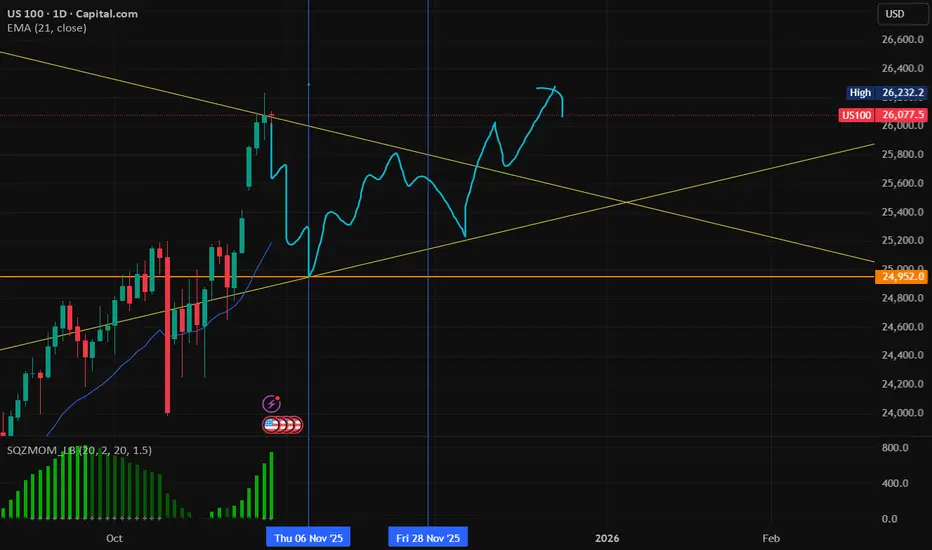
Nasdaq November RED candle and then continue movement.Due since april we have monthly 7 green candles, we need a reversal and red candle in November to continue then the movement to 27,000. But first a back movement to 25,000 and triangle pattern could be the movement for november.
Nasdaq-100 Wave Analysis – 29 October 2025
- Nasdaq-100 broke resistance area
- Likely to rise to resistance level 27000.00
Nasdaq-100 index recently broke the resistance area between the resistance level 26000.00 and the resistance trendline of the extended daily up channel from May.
The breakout of this resistance area accelerated the active short-term impulse wave iii of the impulse wave 5 from the start of Septembers.
Given the strong daily uptrend and rising daily Momentum, Nasdaq-100 index can be expected to rise to the next resistance level 27000.00 (target price for the completion of the active impulse wave iii).

shortthink, we might pump, fail retest down, then end of day come back up.
but if cannot close above, likely hard down first.

NSDQ100 bullish breakout ahead of tech earningsGlobal equities largely consolidated over the past 24 hours, but US tech stocks extended their strong run, propelling the Nasdaq 100 to another record close. The Nasdaq gained +0.80%, outpacing broader benchmarks as AI-related enthusiasm and mega-cap momentum continued to dominate trading.
Market Highlights
Narrow Leadership: Despite the Nasdaq’s gains, market breadth was strikingly thin. Only 104 S&P 500 constituents advanced—the fewest on any up day since at least 1990—underscoring how dependent recent rallies have become on large-cap tech strength.
AI Momentum:
Nvidia (+4.98%) led the charge after CEO Jensen Huang unveiled multiple new partnerships (Uber, Palantir, Crowdstrike), a $1bn investment in Nokia, and plans to connect quantum computing with Nvidia AI chips. Nokia surged nearly 21% to its highest level in a decade.
Microsoft (+1.98%) jumped after revealing a 27% stake in OpenAI, alongside a massive $250bn Azure services commitment from OpenAI, lifting Microsoft’s market cap back above $4 trillion.
PayPal (+3.94%) rallied after an earnings upgrade and a new partnership with OpenAI.
Amazon (+1.00%) advanced despite announcing plans to cut 14,000 corporate roles to streamline operations.
Magnificent 7: The group gained +1.27%, setting fresh highs, with investors rotating further into AI leaders ahead of tonight’s Microsoft, Alphabet, and Meta earnings.
Macro & Outlook
All eyes now turn to the Federal Reserve’s policy decision later today, where a 25bps rate cut is fully priced in. Market participants will parse Chair Powell’s comments for guidance on the pace of future easing and any mention of lingering inflation or financial conditions.
Volatility may rise post-Fed, with the Nasdaq 100 particularly sensitive to any shifts in rate expectations and tonight’s mega-cap tech earnings.
Takeaway
Momentum in the Nasdaq 100 remains intact but increasingly narrow, driven by AI exuberance and corporate partnerships rather than broad-based earnings strength. A dovish Fed and upbeat results from Microsoft, Alphabet, or Meta could reinforce upside momentum—but any disappointment may trigger a sharp reaction given stretched positioning.
This communication is for informational purposes only and should not be viewed as any form of recommendation as to a particular course of action or as investment advice. It is not intended as an offer or solicitation for the purchase or sale of any financial instrument or as an official confirmation of any transaction. Opinions, estimates and assumptions expressed herein are made as of the date of this communication and are subject to change without notice. This communication has been prepared based upon information, including market prices, data and other information, believed to be reliable; however, Trade Nation does not warrant its completeness or accuracy. All market prices and market data contained in or attached to this communication are indicative and subject to change without notice.

Bullish channel breakout on USTEC, potential for further gains? USTEC rose to fresh highs as AI demand and strong semiconductor orders bolstered investor sentiment.
SK Hynix customers have secured its entire memory chip lineup for 2026, reinforcing confidence in tech earnings momentum. Attention now turns to upcoming earnings from Big Tech to gauge the sustainability of the USTEC's rally.
From a technical perspective, USTEC broke out of the ascending channel's upper bound at 26000. If the index sustains its bullish momentum above the 26000 threshold, the price could gain upward momentum toward the 127.2% Fibonacci Extension and resistance at 27200. Conversely, if USTEC returns within the channel and 26000 threshold, the index may retest the support at 25200.
By Li Xing Gan, Financial Markets Strategist Consultant to Exness

US100 – Buyers Take Full Control as Market Breaks Out4H Technical Zone Analysis
Zone 1: Monday’s All-Time High
This zone marks Monday’s all-time high, where the market initially paused after a strong impulse move. The breakout above this level signals clear bullish dominance, but as price extends into record territory, this zone now serves as a potential pivot area. Should price revisit it, traders will be watching for whether former resistance can act as support — a successful retest here would confirm the breakout’s strength and validate continued upward momentum.
Zone 2: Tuesday’s Demand Base
This area represents the level where buyers decisively regained control during Tuesday’s session, driving a sharp rally that broke above prior highs. It reflects the origin of the latest bullish leg and highlights strong demand from institutional participants. As long as price holds above Zone 2, intraday sentiment remains bullish and pullbacks into this area are likely to attract renewed buying interest. A sustained move below, however, would suggest momentum exhaustion and open the door for a deeper retracement.
Sentiment Overview
The Nas100 surged yesterday, driven by a wave of optimism following encouraging headlines on both the macro and geopolitical fronts. Markets rallied after reports of a “constructive” round of US-China trade talks in Malaysia, which eased fears of renewed escalation and reignited risk appetite across global equities. At the same time, a softer-than-expected US CPI print reinforced hopes that inflation pressures are moderating, prompting renewed speculation that the Federal Reserve could adopt a more dovish tone once government operations resume.
Tech and semiconductor stocks once again led the advance, supported by strong earnings and continued enthusiasm around AI and digital infrastructure. The index pushed into fresh record territory, underscoring how dominant the tech sector remains as a driver of sentiment.
Heading into today’s session, the tone is cautiously constructive. The market is buoyed by improved trade relations and stable inflation expectations, yet traders are aware that valuations are stretched and macro visibility is limited due to the ongoing US government shutdown. With key data releases delayed and the index at all-time highs, volatility could spike on any unexpected headlines or shifts in tone from policymakers.

Nasdaq 100 Trade ideaLet’s see how it reacts to this BISI, could be seeking for the highs it just created.

NAS100 – Price Enters Uncharted TerritoryZone 1: New All-Time High
This zone marks where the US session closed yesterday, establishing a new all-time high. Price has never traded this high before, putting the market in uncharted territory. Momentum remains strong, but with no historical structure above, traders should watch for signs of exhaustion or potential profit-taking as price explores this fresh high ground. A clean break and hold above the zone would confirm continued bullish control, while early rejection could spark a minor pullback.
Zone 2: Asia Session Open
Price opened around this level during Monday’s Asia session before accelerating sharply higher. The strong reaction from this area confirms it as an intraday demand zone and the first meaningful layer of support if price retraces. Should the market revisit this level today, traders will be watching closely for renewed buying pressure to defend the short-term uptrend.
Zone 3: Previous All-Time High
This zone marks last week’s US session close and the previous all-time high before the breakout. It now serves as deeper structural support, the base of the current rally. As long as price holds above Zone 3, the broader bullish structure remains intact. A clean break below, however, could suggest fading momentum and open the door for a deeper correction toward the prior range.
Today's sentiment
The Nas100 continues to trade with a cautiously positive bias after last week’s sharp rebound. Optimism is underpinned by improving risk sentiment, strong momentum in mega-cap tech, and renewed hopes that the Federal Reserve could adopt a more accommodative stance as inflation pressures ease. The partial US government shutdown, however, has delayed key macroeconomic releases, leaving markets “flying blind” and amplifying the potential impact of every new headline.
Geopolitical developments also remain in focus: progress in US–China trade dialogue has helped calm nerves, but investors are aware that tensions over technology exports and global supply chains could resurface quickly.
For traders, the setup favors tactical flexibility. Tech remains the market’s driving force, but with valuations stretched and volatility likely to spike on sparse data or political noise, short-term positioning and disciplined risk management are essential. In short, sentiment is constructive, but fragile.

NAS100 – Technical Analysis | Bulls Take ChargeNAS100 extended its bullish rally after breaking above 25,190.00 and 25,600.00, confirming strong buyer control. The index continues to print higher highs, with momentum favoring further upside as long as price remains above the breakout zone.
Support at: 25,600.00 🔽 / 25,190.00 🔽 / 25,000.00 🔽
Resistance at: 25,900.00 🔼 / 26,000.00 🔼
🔎 Bias:
🔼 Bullish: Sustained trading above 25,600.00 supports continuation toward 25,900.00 and possibly 26,000.00.
🔽 Bearish: A drop back below 25,190.00 could trigger a correction toward 25,000.00.
📛 Disclaimer: This is not financial advice. Trade at your own risk.

$NDX Reaches 161.8% Fib ExtensionNASDAQ:NDX has again reached the 161.8% Fib Extension in its latest move of this Bull Market. The last time this occurred was July 10th, 2024. A key difference this time is that SP:SPX is not concurrently reaching the same extension, and is instead lagging in pace.

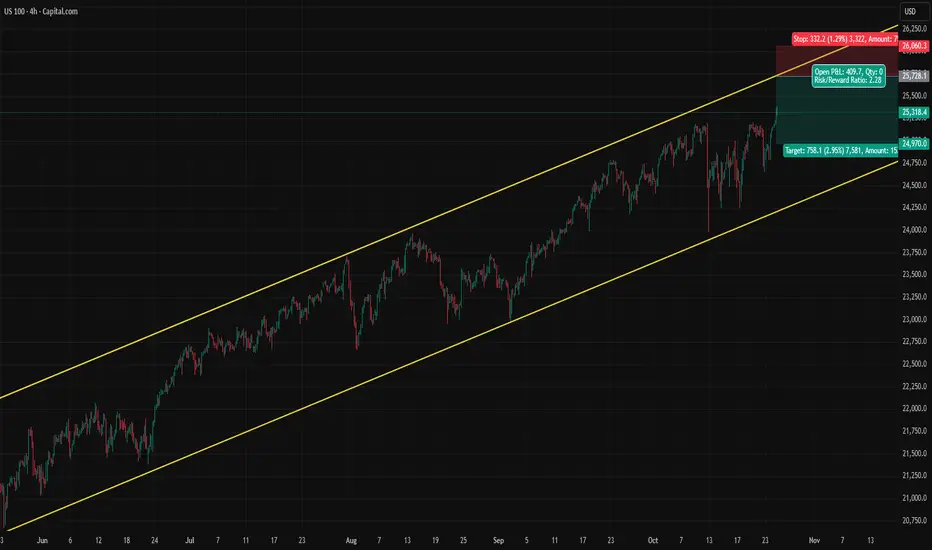
Nasdaq Enjoys CPI, But How Much More?Nasdaq still trending up, enjoying the today's lower than expected CPI data. If it ride towards the upper line of the channel, it likely to get rejected. I don't see any reason for an upside breakout at the moment. Setup is for today and Monday, I will deactivate my order after Monday.
Risk/Reward: 2.28
trade 2Scenario 1: Buy Limit @ 25376 i.e value-based buying
SL @ last blue cambist line
Risk 0.4%
R:R 1:1

NAS100NASDAQ tends to break the MA2 zone after retest MA5 zone with high volume but the second scenario it did not complete regular correction yet but as my work I trade stocks only that is enough to push stocks this day liquidity and this is the zones and the weak liquidity line
#MA_Strategy

NAS100 Trade Set Up Oct 27 2025Price has broken PDL and made ATH during Asia session so i am expecting a sweep of SSL then internal structure on the 1m/5m forming CISD/IFVG to continue higher to BSL/London highs

Nasdaq 100 Analysis: Index Reaches an All-Time HighNasdaq 100 Analysis: Index Reaches an All-Time High
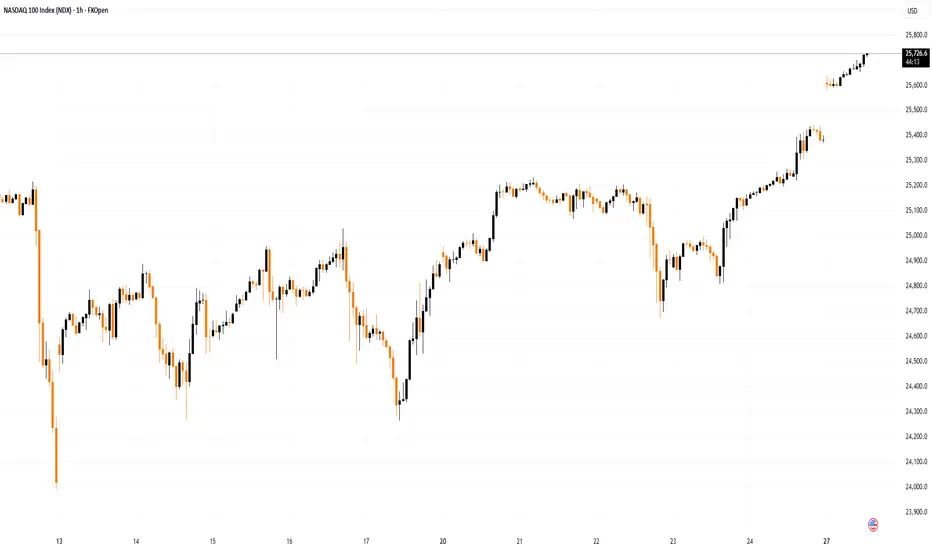
As the chart shows, trading in the Nasdaq 100 opened with a bullish gap today, with the price rising above the 25,600 mark for the first time in history.
The upbeat sentiment is being driven by:
→ expectations of a potential interest rate cut, with the Federal Reserve’s decision due on Wednesday;
→ the upcoming meeting between Chinese and U.S. leaders, where the presidents may announce a new trade agreement;
→ anticipation of quarterly earnings reports from major tech firms – Amazon (AMZN), Apple (AAPL), Microsoft (MSFT), Alphabet (GOOGL) and Meta Platforms (META) are all set to release results this week.
Technical Analysis of the Nasdaq 100 Chart
A closer look at the hourly Nasdaq 100 chart, within the context of this month’s volatility, shows a steady recovery from the sharp drop on 10 October – the day President Trump suggested imposing 100% tariffs on Chinese goods.
The contours of that sell-off can now be used to outline an ascending channel, which neatly captures the market’s current price swings. Notably, today the index climbed into the upper half of that channel, overcoming resistance levels at:
→ the channel’s median line;
→ the 25,220 mark.
Since last Thursday’s low, the price has advanced by more than 3.5% – a strong rally – forming a steep upward trajectory (highlighted in orange). In this context:
→ the next potential target lies at the upper boundary of the blue channel, which would mark a new record high near 26,000 for the Nasdaq 100;
→ however, with RSI signalling overbought conditions, a short-term correction towards 25,500 would be a healthy development.
Should this week’s key events deliver the optimism investors are hoping for, the bulls may well succeed in reaching those ambitious targets.
This article represents the opinion of the Companies operating under the FXOpen brand only. It is not to be construed as an offer, solicitation, or recommendation with respect to products and services provided by the Companies operating under the FXOpen brand, nor is it to be considered financial advice.
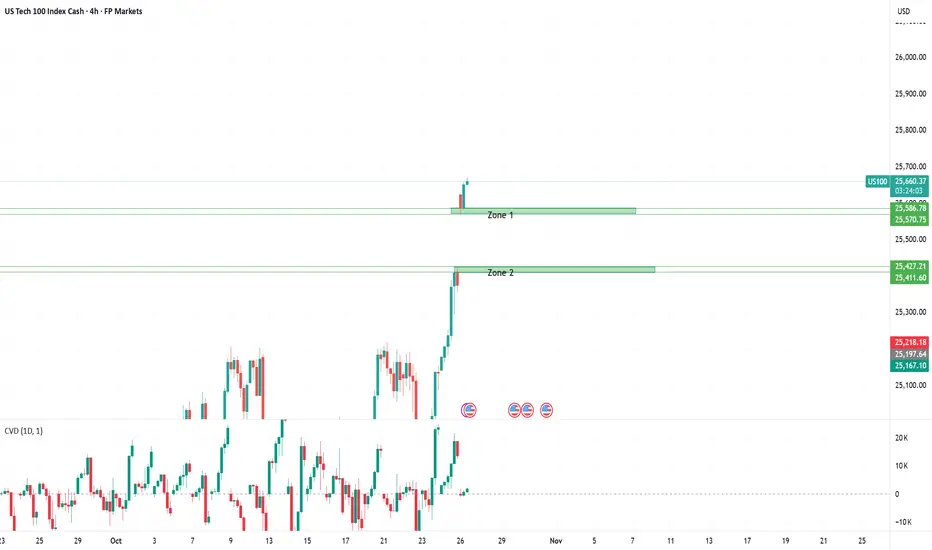
Nas100 opens the week with explosive strength4H Technical Zone Analysis
Zone 1 (25,570 – 25,586): Today’s Low / Asia Session Open
This zone marks where price opened during the Asia session today after a sharp weekend gap to the upside. The fact that price held this area cleanly suggests that buyers immediately stepped in to defend the breakout, confirming it as a short-term demand zone. As long as price remains above Zone 1, intraday momentum stays firmly bullish, and any retest here could attract further buying interest.
Zone 2 (25,411 – 25,427): Last Week’s All-Time High
This zone represents last week’s all-time high, now turned into support after the breakout. The strong impulse above this level indicates that what was once a major resistance has now flipped into a structural base for the new leg higher. If the market revisits Zone 2, it will serve as a key test of buyer strength and validation of the breakout’s sustainability. Holding this zone will reinforce bullish market structure, while a clean break below could expose the unfilled gap beneath.
Market Gap – What It Means
Between Friday’s close and today’s open, price created a large upside gap, reflecting aggressive post-market buying and strong bullish sentiment carried into the new week. Such gaps often occur when new information — in this case, easing trade tensions and continued strength in tech earnings, triggers a rush of buy orders before the regular session begins.
However, gaps of this size also leave “thin liquidity zones” below, areas where price moved so fast that few transactions took place. These can act like magnets for future price action, as markets often “fill the gap” later to establish balance. In other words, while the gap confirms bullish momentum, traders should remain aware that it could eventually retrace to retest lower liquidity levels before resuming higher.
Today's sentiment
The Nas100 ended last week on a strong note as optimism returned following constructive U.S.–China trade talks in Malaysia. U.S. Treasury officials described the discussions as “productive,” easing fears of renewed escalation and boosting risk appetite. Strong earnings from major tech and semiconductor firms, including TSMC, further supported sentiment, reinforcing the view that AI and digital infrastructure remain bright spots amid global uncertainty.
Heading into the new week, the tone is cautiously optimistic: the market is supported by tech strength and improved trade relations, but with valuations near record highs and limited macro data due to the U.S. government shutdown, investors remain alert to any sudden shifts in tone or headlines.
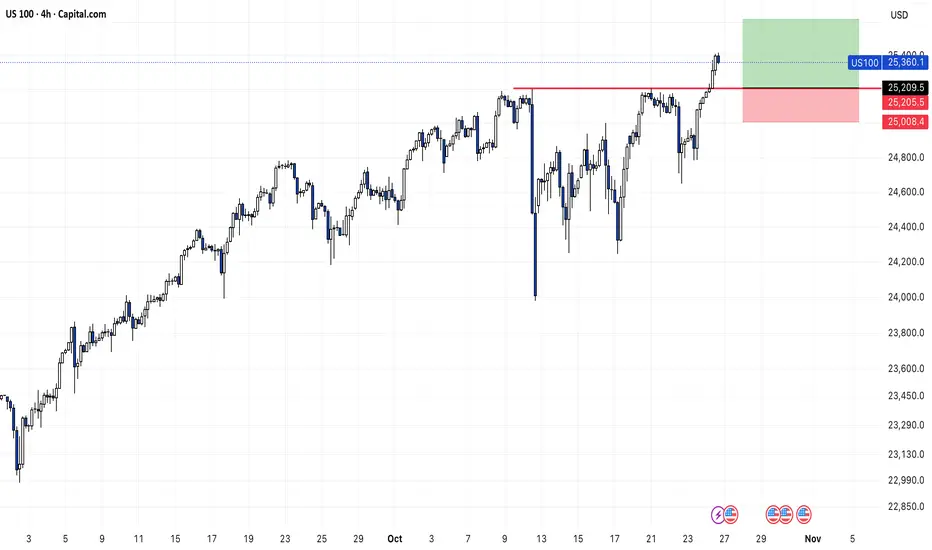
US100 BULLISHbullish on all timeframes apart from 1min and 5min.
price has just broken through previous swing high.
ill be waiting for a correction and will be entering a long position with a 2:1 rrr.
but I will be looking to take partial profits and allowing trade to run if price action is still show bullish strength.
NAS100US100 created a NH as price is changing direction creating a bearish peanant, price to retrace back to resistance before it dumps..Trade safe and be Blessed..

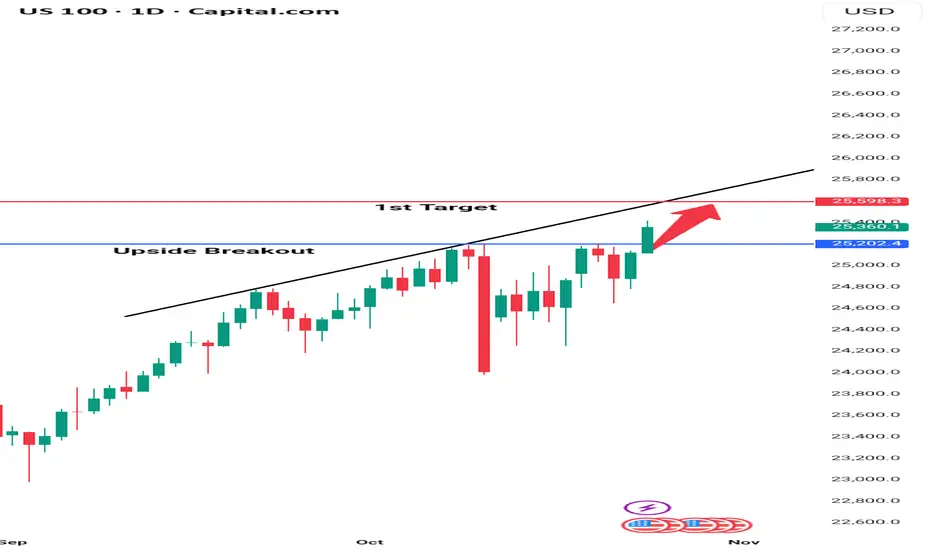
US 100 Upside Breakout – Target in SightUS 100 has broken above key resistance at 25,074, confirming a bullish breakout. Price is now at 25,508, supported by VWAP and 5 EMA. Momentum favors buyers, with the 1st target near 27,000, expected to be reached in the upcoming week if trend strength continues. Ideal entry on pullbacks or bullish continuation candles. Place stop-loss below breakout zone at 24,800 to manage risk. Watch for volume confirmation and sustained price action. This setup offers a short-term opportunity for swing traders aiming to ride the breakout wave.
Naz 100 into the new weekPop higher on good earnings.?
Or bad news and we get a retrace into support

NAS100 Intraday & Swing Trade Setup🎯 NAS100 (NASDAQ-100) Technical Analysis: Oct 27-31, 2025 | Intraday & Swing Trade Setup
Closing Price: 25,373.7 | Date: Oct 25, 2025 12:54 AM UTC+4 | Timeframes: 5M, 15M, 30M, 1H, 4H, 1D
━━━━━━━━━━━━━━━━━━━━━━━━━━━━━━━━━━━━━━━━━━━━━━━━━━━━
📊 ELLIOTT WAVE & STRUCTURAL ANALYSIS 🌊
From the daily chart perspective, NAS100 shows completion of Wave 4 correction around 25,100-25,200 support zone. Current positioning at 25,373.7 suggests early Wave 5 development with bullish impulse structure emerging. The 4H timeframe confirms impulsive uptrend with higher highs and higher lows—classic Elliott Wave signature for institutional accumulation phase.
💡 KEY INSIGHT: If 25,900-26,050 resistance breaks decisively on 4H close with volume confirmation, we target Wave 5 extension toward 26,400-26,800 range through mid-week.
━━━━━━━━━━━━━━━━━━━━━━━━━━━━━━━━━━━━━━━━━━━━━━━━━━━━
🔄 DOW THEORY & TREND CONFIRMATION ⬆️
Primary Trend: Bullish | Higher highs established above 25,600 on 1H charts
Secondary Trend: Consolidation above 25,300-25,350 support validates buyer control
Confirmation Signal: Volume surge on breakouts above 25,900 confirms institutional participation
The daily VWAP sits at 25,420, acting as dynamic support. Price trading above VWAP with 1D EMA(20) > EMA(50) > EMA(200) alignment signals strong bullish conviction for the coming week.
━━━━━━━━━━━━━━━━━━━━━━━━━━━━━━━━━━━━━━━━━━━━━━━━━━━━
⚡ INTRADAY SETUPS: 5M TO 1H TIMEFRAMES
5M & 15M: Utilize Ichimoku Cloud crosses for quick scalp entries. Tenkan-sen/Kijun-sen crossover signals 3-5 minute momentum trades. Bollinger Bands (20,2) show tight squeeze—breakout imminent. RSI <30 on 5M = panic-sell exhaustion reversal opportunity.
30M: This is the swing trader's sweet spot . Harmonic patterns—particularly Butterfly and Bat patterns—should be monitored around 25,200-25,100 support confluence. Gann angles from Oct 22 low project resistance at 25,888, 26,150.
1H: Primary intraday timeframe for entry/exit. Support: 25,300 (VWAP), 25,100. Resistance: 25,900 (breakout trigger), 26,050. RSI overbought above 70 = profit-taking zone. EMA(9) above EMA(21) = trend strength confirmation.
━━━━━━━━━━━━━━━━━━━━━━━━━━━━━━━━━━━━━━━━━━━━━━━━━━━━
🎪 WYCKOFF METHOD & ACCUMULATION PHASE 📈
Current price action displays classic Wyckoff accumulation: Spring formation around 25,200 + subsequent recovery above neckline. Effort (volume) on upside breakouts now exceeds effort on downside—textbook Wyckoff buying climax setup. Watch for secondary test of 25,300—if holds above with lower volume, expect breakout run to 26,000+.
⚠️ WARNING: Climax volume spike above 26,000 may indicate exhaustion—take profits on target.
━━━━━━━━━━━━━━━━━━━━━━━━━━━━━━━━━━━━━━━━━━━━━━━━━━━━
🔷 HARMONIC PATTERNS & FIBONACCI LEVELS 📐
Gartley Pattern forming in 4H with D-point targeting 25,850-25,920 (78.6% Fib retracement). Potential risk/reward ratio of 1:3+ makes this ideal swing entry zone. Support cluster: 25,300-25,420 (multiple MA confluence + VWAP). Extended Fib target: 26,400 (161.8% extension from Oct 22 impulse base).
━━━━━━━━━━━━━━━━━━━━━━━━━━━━━━━━━━━━━━━━━━━━━━━━━━━━
📍 TRADING PLAN: MON-FRI (OCT 27-31) 🗓️
INTRADAY SCALPERS (5M-30M): Target 25,750-25,850 breakout on Monday. Stop: 25,250. Take profit 1: 25,650 (+300 pips). Repeat breakout patterns on every higher low formation.
SWING TRADERS (4H-1D): Accumulate longs 25,300-25,420 on dips. Primary target: 26,150-26,250 (Wave 5 target). Secondary: 26,400-26,800. Stop loss: 24,900 (break below daily cloud). Risk/reward: 1:2.5 minimum.
⏰ OPTIMAL TIMING: US market open (13:30 UTC) provides best 5M-1H breakout volatility.
━━━━━━━━━━━━━━━━━━━━━━━━━━━━━━━━━━━━━━━━━━━━━━━━━━━━
🚨 REVERSAL & BREAKOUT SIGNALS 🎯
Reversal Alert: If RSI divergence forms (lower high on price, lower high on RSI) at 26,000+ = sell-off imminent. Initial support: 25,650. Hard stop: 25,420.
Breakout Confirmation: Volume >200M shares on 4H close above 26,000 = institutional breakout, extend targets to 26,600+. Failure to hold 25,900 three times = bullish setup invalidation.
━━━━━━━━━━━━━━━━━━━━━━━━━━━━━━━━━━━━━━━━━━━━━━━━━━━━
📊 VOLATILITY & BOLLINGER BAND SQUEEZE 📉
Current Bollinger Band width suggests compression before expansion . Watch 1H BB (20,2) for band walk breakout into 26,000+ on closing above upper band. ATR expansion above 250-300 points validates trending move. Consolidation below upper band = power accumulation before next leg up.
━━━━━━━━━━━━━━━━━━━━━━━━━━━━━━━━━━━━━━━━━━━━━━━━━━━━
⚖️ RISK MANAGEMENT CHECKLIST ✅
Daily loss limit: 2% portfolio | Use 1:2 minimum risk/reward ratio
Position sizing: Reduce entries above 26,200 (resistance cluster)
Breakout confirmation: Require 5-minute close above resistance + volume spike
Support holds: If 25,300 closes below on daily, trend invalidates—exit swings
━━━━━━━━━━━━━━━━━━━━━━━━━━━━━━━━━━━━━━━━━━━━━━━━━━━━
🎓 Technical Theory Applied: Elliott Wave (Wave 5 setup) | Wyckoff (Accumulation completion) | Dow Theory (Higher highs confirmation) | Harmonic Patterns (Gartley D-point) | Gann (Angular resistance) | Japanese Candlesticks (Bullish engulfing on 4H)
🛠️ Indicators Aligned: Bollinger Bands (squeeze breakout), RSI (bullish divergence), Volume (accumulation), VWAP (dynamic support), MAs (uptrend slopes), Ichimoku Cloud (bullish crossover).
📈 Bias: BULLISH with caution above 26,200
━━━━━━━━━━━━━━━━━━━━━━━━━━━━━━━━━━━━━━━━━━━━━━━━━━━━
⚠️ Disclaimer: This post is educational content and does not constitute investment advice, financial advice, or trading recommendations. The views expressed here are based on technical analysis and are shared solely for informational purposes. The stock market is subject to risks, including capital loss, and readers should exercise due diligence before investing. We do not take responsibility for decisions made based on this content. Consult a certified financial advisor for personalized guidance.

Nasdaq bullish moves on Roller Coaster Nasdaq bullish moves on Roller Coaster. It seems likes bulls & bears are confused.
