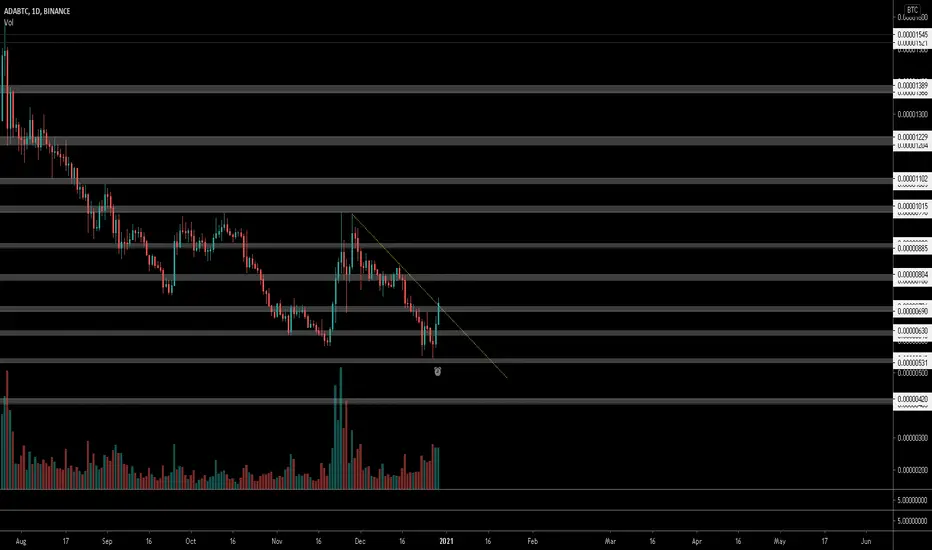
Cardano (ADA) Looking To Grow vs BitcoinCardano (ADABTC) has been dropping since it peaked back in July 2020.
Last week we ended with a Doji and a higher low compared to Jan. 2020.
This can be the beginning of a change of trend.
If this higher low holds, marked with a vertical grey line, we will see a higher high on the next bullish move.
This can lead to double the current price or even higher... You can find more details on the chart.
Namaste.
Trade ideas


Cardano Mooning oportunityCardano is on a very good area for a long oportunity. It is smelling like Alt season. Trade cautiously, markets are extremely volatile

ADABTC: Not Long Before Reversal to Sustained Upward Pressure...Hi Everyone! PLEASE do not freak out and sell your major alts for bitcoin right now. My opinion of course... It won't be long before we see reversal to sustained upward pressure in my opinion...

On supportHello everyone,
ADA/BTC as been struggling lately by the moves of btc. The weekly rsi at btc is almost at 94% giving clear signals of a possible correction next week.
We are currently on the big support from the start or the rally for ada since January and looking to closes the weekly over the dynamic support at 553 sats (I expect Sunday to be good for alts after a rejection from the resistance at the dominance arround 73%). If the support holds, we may expect a bounce to the area of 1450 / 1300 sats in the next 3 weeks. At the current value of btc we should expect a target of 0.46$ / 0.40$ USDT just a little over the resistance at 0.388$ USDT.
Now we need to know if the dynamic resistance (in green) will create a symetrical triangle or just act as a dynamic resistance.
In case of a symetrical triangle the target would be 7500 sats with a possible breakout arround November 2021. I don't think we are playing with a symetrical triangle because of fundamentals playing arround, like Goguen in the next months or the effect of an altseason.
Be safe!

Ada/btc 64% anyone?!Ada/btc is printing a pretty solid looking divergence (bullish obviously) on the daily. There may be a little more downside, but the reward outweighs the risk. Good luck y’all!

ADA/BTC forming a clear falling wedge and bullish divergenceFundamentals and price action are aligned. Around the months of March/April full decentralization and smart contracts will be achieved. The DeFi ecosystem is prone to flourish due to a high expectation, which will translate in more supply locked into contracts and greater demand. This is what the market is specting from Cardano, lets see if they can deliver on time, TA shows that is very likely.

ADA/BTC forming a clear falling wedge and bullish divergenceThis could play out. There are no fundamental reasons to think otherwise.


Cardano (ADABTC) good setup for buyingCardano has one of the most active projects on Github and the team is working on the developments continuously. ADA tested the support line and forming a triangle. We will see a breakout anytime. ADA will be huge after it breaks the 1000 resistance zone.
Buy Zone: 610-625
Target: 690-740-790-850-915-970-1070-1150-1270-1380-1500-1800
Add more in dips

ADA bullish divergencePlease feel free to share your view on this pair down below in the comment section. I'm more than happy to be challenged and have an interaction on this idea.
Also make sure to leave a like as it helps me out a lot!
------------------------------------------------------------------------------------------
Cardano is looking interesting. Finding support on the range it was in for over almost a year. With a bullish divergence on the RSI.
When it touched here in november we saw a nice 50% rally towards the resistance at 936.
If Bitcoin retraces and fulfills its blow-off top, we could see Cardano move further toward the 1200 level.
What do you think about ADA? Long term hold? Or just a trade?

Ada is breaking a resistanceAda currently is trying to break up a resistance. If Ada successes in this then it can go up to 1000 sats and more.

ADA/BTC Two Possible Bullish ScenariosOne of both could play out. The 500-ish sats zone is a good bet for a long entry imo. Overall at this levels I believe is more convenient to hodl for the medium/long term. Thoughts?

If Take Hold Above The 720 sat Resistance Bullish Trend Will Con❕Sitting Above The Long Term Support Line ,If Take Hold Above The 720 sat Resistance Bullish Trend Will Confirm
🔴 Stop loss zone : 630 ~ 625

$ADA, Showing interesting volume (similar to November...)$ADA
Showing interesting volume (similar to November where it moved up to ~70% )
Currently trying to recover ~700 sats level on a W shaped bottom & crossing over descending trendline..
UCTS signalling buys on LTFs but looking for a 1D buy (which are usually quite strong)
#ADA

ADABTCCardano seems to have a diametric pattern and wave F will begin soon. There are two scenarios and both of them could occur.

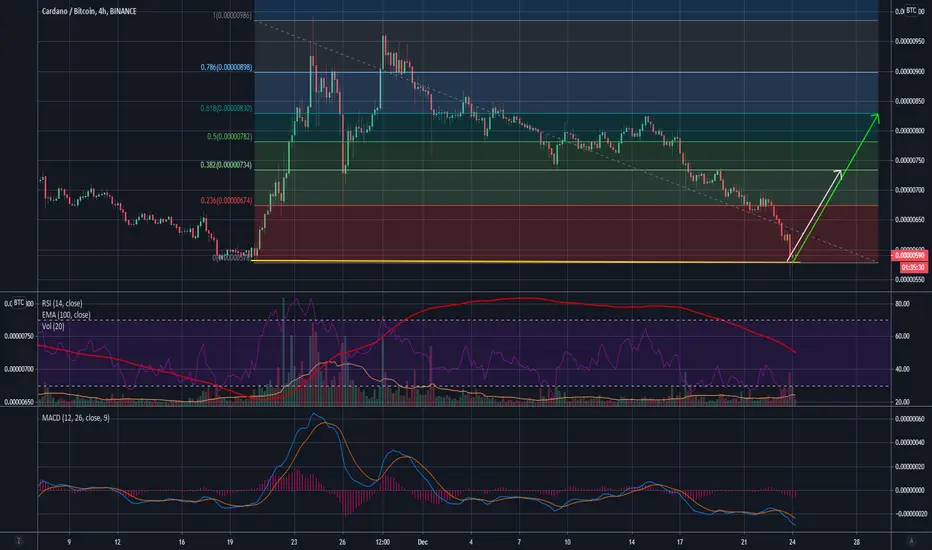
Cardano Full Trade Signal (ADABTC)(452%)Here we have Cardano (ADABTC) after bouncing off support.
A new bullish wave can easily develop here.
Below the numbers...
--------
BUY: 0.00000600 - 0.00000660
NEXT SUPPORT: 0.00000580
TARGET:
1) 0.00000850
2) 0.00000995
3) 0.00001335
4) 0.00001550
5) 0.00001850
6) 0.00002020
7) 0.00002300
8) 0.00002750
9) 0.00003500
STOP: Close weekly below 0.0000500.
--------
This is not financial advice.
Thanks a lot for your support.
Namaste.

ADA.BTC (Y20.P6.E1).Bottom is in?Hi All,
With yesterdays capitulation, it is a good sign that the bottom is in for many coins, at this point, I'm thinking ADA and ETH.
My TA on this chart:
> It makes sense that the previous accumulation zone for ADA would be the level of strong support, yellow zone to the previous rally.
> It makes sense that the support area will be above this area, as per my buy zone
> I have the Inverted BARR strategy cycle starting as per my chart, meaning the cycle started here and will end up here for then next round. So far it has confluence on this.
> I have the top down trend line making a strong resistance, confluence with my ABCDE reversal pattern and fib levels as well.
> With the daily indicators, I have them crossing over on the daily, giving a positive sign as the bottom is in.
> Having a bullish divergence after a capitulation on the daily along a support line with a bullish engulfing candle is a strong business case.
Hence I'm bullish now on ADA.
I also have the ADA.USDT matching this bottom reversal formation, I will post this separately but here is the chart.
ADA.BTC Daily chart with indicator focus:
Please give me a like or tick for this post.
Regards,
S.SAri

ADA/BTC
ADA/BTC
Place order at 580 , AB=CD
Targets midterm : 1590, 1750
Stop day close below 580.
Risk/Rewards 5%/ 200%

ADA has reached a support levelFirst of all, the market in general is not looking good, but we should start seeing some upward moves.
TP1 would be 733
TP2 would be 818
The market is very volatile at the moment, so I would not be happy with more than a 5% SL, (<560)
It might be better to leave this trade on the table until 2021
Merry Christmas everybody!