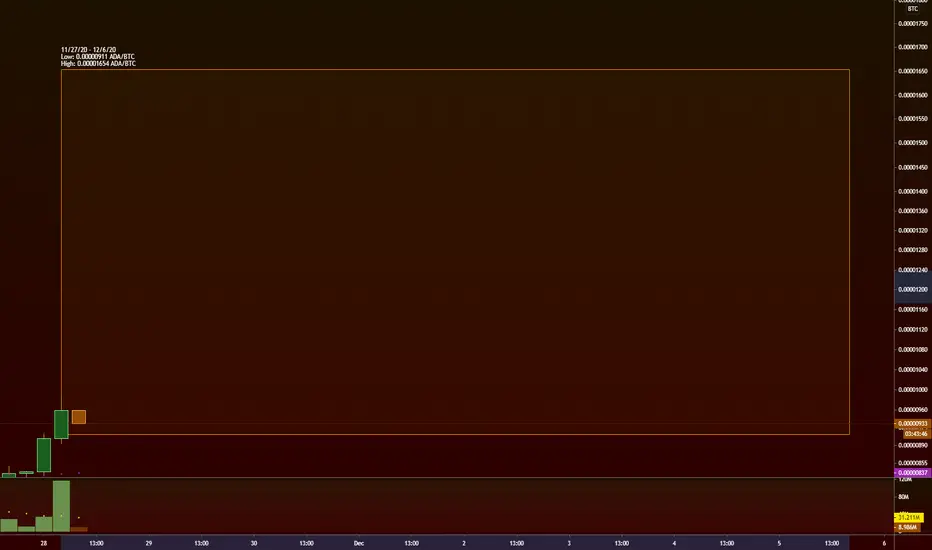
Cardano Weekly (Nov 27th - Dec 6th 2020)Cardano (ADA)/BTC rates (November 27th through through December 6th 2020)
Low: 0.00000911 ADA/BTC
High: 0.00001654 ADA/BTC
Last weekly forecast went decent and I think the larger drop and floor of my last long term forecast for Cardano may not come until after this current wave we are going through is done.
Thanks for tuning in :) Disclaimer, anyone in the trade needs to do their own due diligence and decide what is right for YOU. My charts can be wrong at any time and it's very important that you have your own strategies and plans in place. I run this channel for my own educational purposes of learning to trade, and I will never be 100% right, so please do not let me confirm any bias for you! (Dangerous to do so, stay safe and remember the basics & rules of risk assessment.) Expect the unexpected and happy trading!
Trade ideas
$ADA, ~20% up today after a deep pullback (trendline retest?)$ADA
~20% up today after a deep pullback (trendline retest?)
Willing to see if manages to break over previous high at around 1000sats(previous high)
Took the entry at UCTS 1D Buy signal
Looking for a new 2020 ATH 😏
#ADA
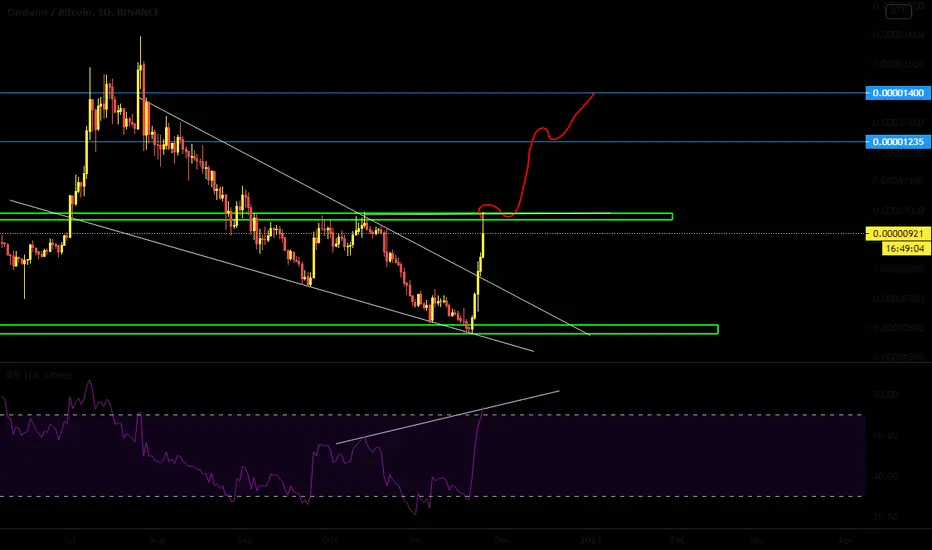
Cardano ADA price Above Resistanceprice is now above resistance and try to flip this resistance to support
need weekly close above this resistance for higher move.
if price able to hold this zone than next target are 1000 , 1300 satoshi


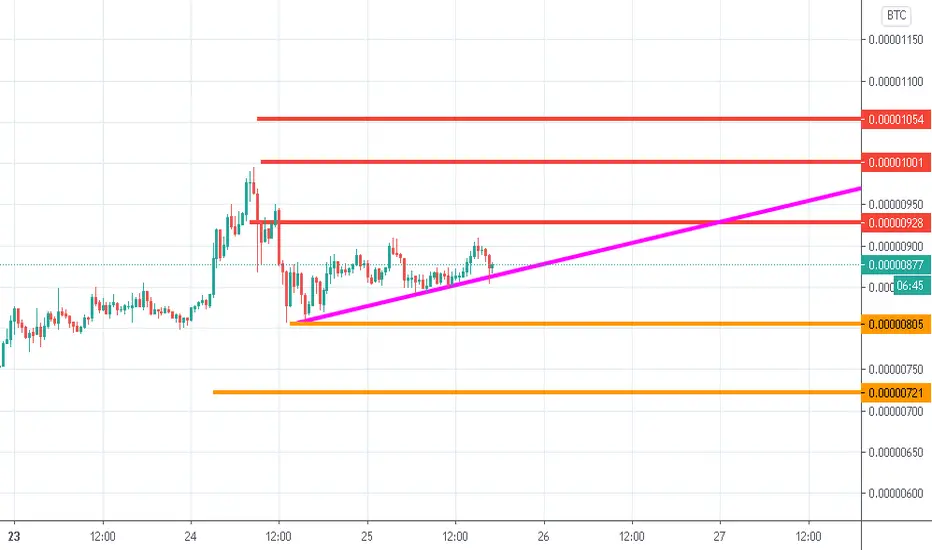
New attempt. It's probable this time we can finally cross it.
Resistances to watch: 770, 810, 906, 947.

ADABTC long Risk warning, disclaimer: the above is a personal market judgment based on published information and historical chart data on Tradingview, all analysis is only subjective. Hope investors consider, I am not responsible for your investment decision. Thank you.
Good luck!
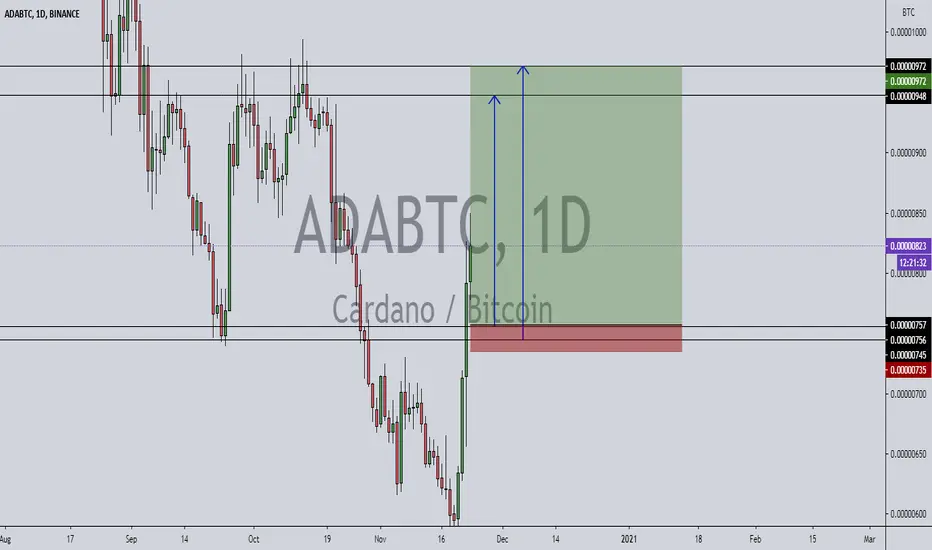
ADABTC - Long - Potential 101% - BlockFriday - Long Term HodlADABTC - Long - Potential 101%
***BlockFriday - Long Term Hodl***
Entry- 782
TP1- 987
TP2- 1075
TP3- 1317
TP4- 1477
TP5- 1585
SL- 396
- Expect a long hold - Entry can drop lower
- RR - 2.04
- Trailing Buy - 5%
- Trailing Profit - 10%
- Trailing Stop-Loss - No

Cardano ADA price Analysis 2020Cardano one of great coin to discover.
have a good luck.
1 of the cheapest coin favour by people.
Its founder and CEO Charles Hoskinson calls it a third-generation cryptocurrency, meaning that it already has some of the features that earlier cryptos are struggling to implement.

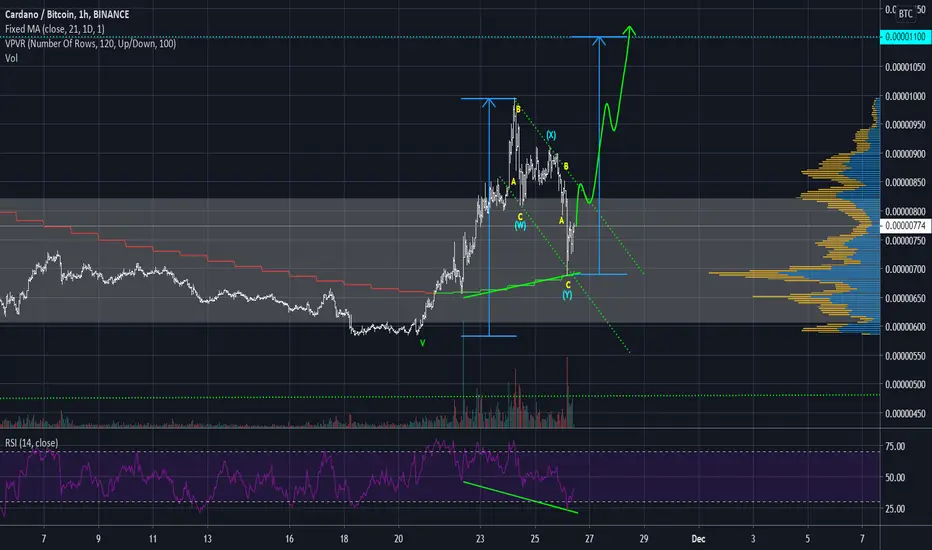
ADA/BTC - buying the dip !ADA/BTC is currently in big grey support area, we are testing 21 daily MA, we have nice bullish divergence on RSI, so we should see another move to the upside, at least to 1100 satoshis.
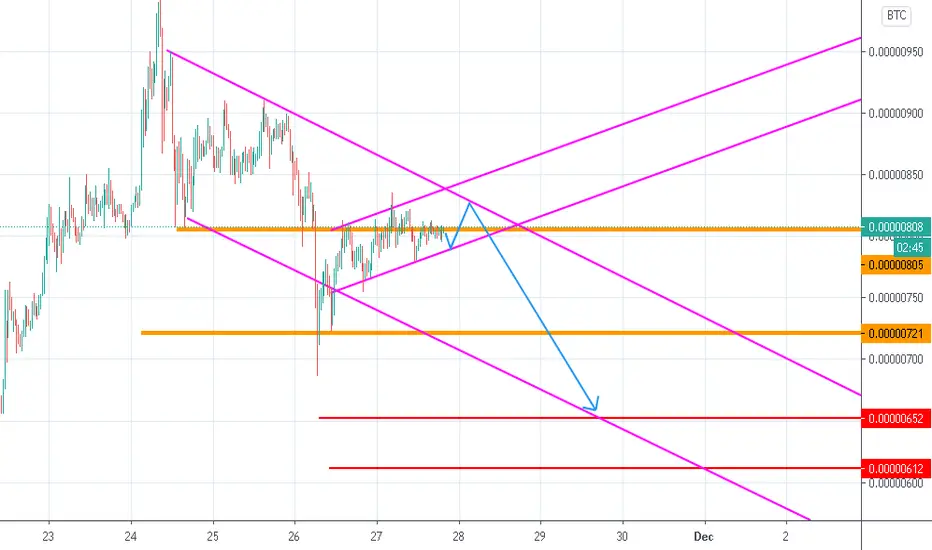
ADA/BTC "LONG" POSITIONADA CONTINUES ITS RISE TREND. The pattern is canceled below the orange line. Red lines indicate 3 targets. The purple line is the trend line . The risk increases if it falls below the purple line. If bitcoin experiences a sudden price movement, it can drop to 754. Stop lose should be kept close
COMIN 4 YAWhat are the thoughts on the ripple boom? Why ripple? The market is quite calculated, I'm excited for ADA. I expect rocket ships.

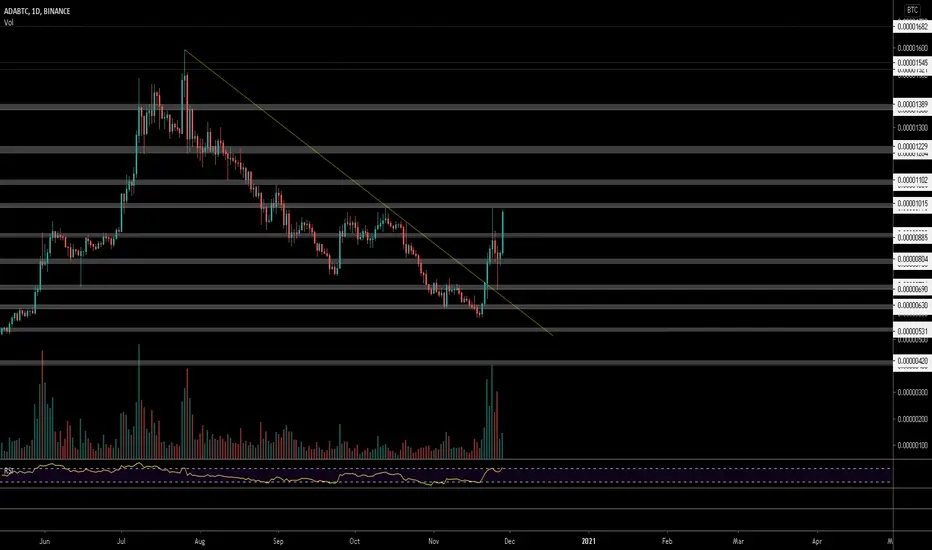
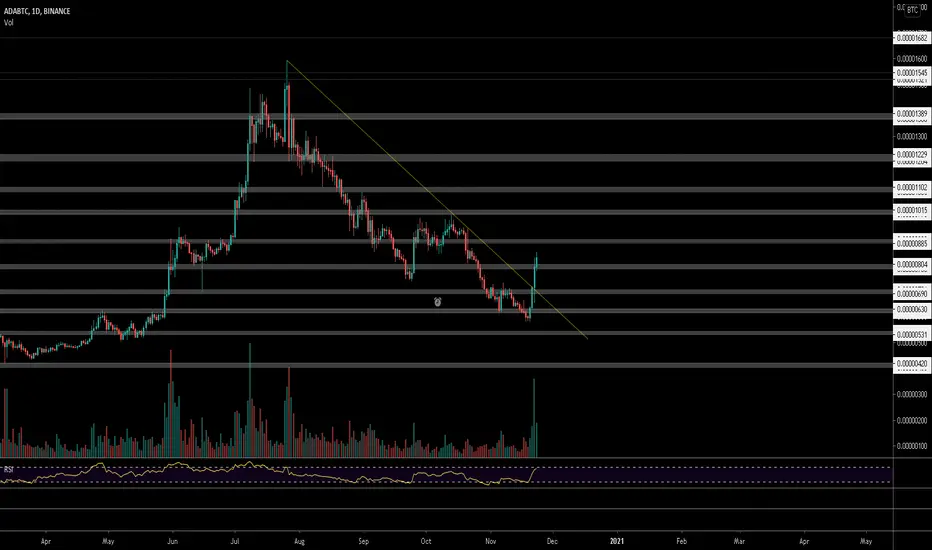
$ADA, Impressive volume as it breaks from descending trendline$ADA
Impressive volume as it breaks from descending trendline built from mid 2020..
UCTS Buy signal on the daily are usually quite strong on this chart as well so willing to take a chance on the way up..
Currently testing ~800 sats level (hodl/flip for continuation)
#ADA

ADA Potential Breakout above 1000 Satoshis We are just at the beginning of the ascending wedge accumulating from 880 - 950 Satoshis
Keyy Breakout above 1000 once that breaks we are going to 1250 - 1300 satoshis ( 0.23 - 0.25)

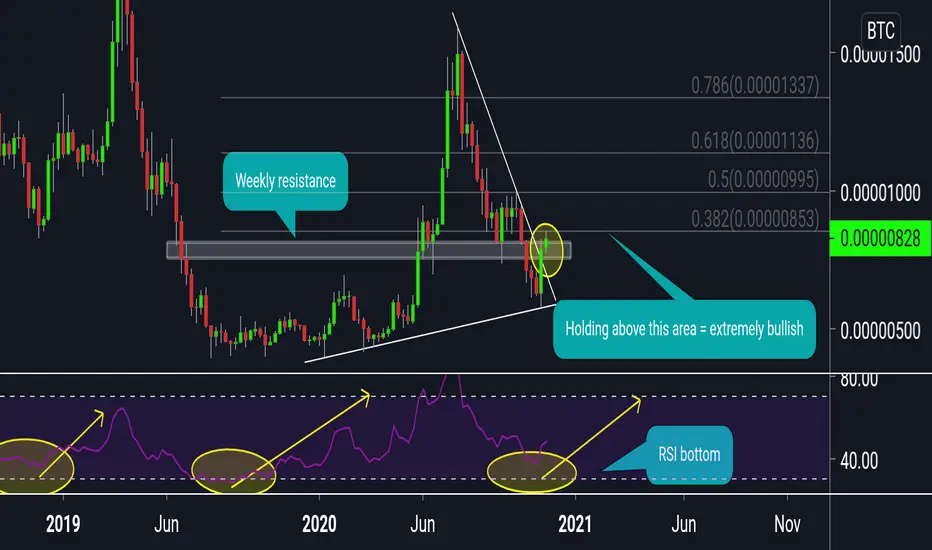
Cardano (ADA) weekly chartADA / BTC
🌟 Techincal Analysis🌟
Hi guys
Ada recently started to pump hard again
Looking at weekly chart you can see :
1- It just broke strong horizontal resistance
2- Broke trendline resistance
3-On bottom of RSI its show bullish reversal signs
4-Great volume entered last few days
5-btc dominance start to decrease (alt season)
All this are bullish signs
Now ada Got rejected from 855 sat (0.382fib)
If ada managed to hold above this fib resistance
We can see next targets in Fibonacci
995 sat
1136 sat
1337 sat
Good luck and happy trading 🌹

ADABTCADABTC
Buying around 0.00000686 - 0.0000062
1 - 0.00000790
2 - 0.00000925
3 - 0.00001050
Fixation below 0.00000583, the price may turn into accumulation
✅ f you like what I do, put 👍 and subscribe
Waiting for your comment, what do you think about this?


Cardano: This is EET!The rocket ship is taking off for the last time. Never been a better time to buy than right now.

Cardano (ADA) MACD Bullish Divergence SignalCardano (ADABTC) has been shaking, down, each time Bitcoin moves... Finally, we are seeing it going green with Bitcoin also green.
Let's have a look at the strong bullish divergence with the MACD.
See here:
In late August the MACD goes flat for ADABTC.
Yet, ADABTC is going on a strong correction at this time (lower lowers).
The MACD is also above the signal line with a green histogram.
When we look at the chart, we can see prices moving above EMA10 today and little volume... Other than the bullish divergence, these signals are still weak.
The RSI is looking "good" (40+) but needs yet to reach "strong" (50+)... So this is a work in progress yet, the bullish action is sure to come.
Namaste.

ADA CARDANO 4H Breakout - ADABTC ADAUSD ADAUSDC ADAUSDT ADAETHADA CARDANO 4H Breakout - ADABTC ADAUSD ADAUSDC ADAUSDT ADAETH
