Adani Enterprises looks vulnerable on the charts, bearish viewAdani Enterprises looks vulnerable on the charts. Levels around 1550 could be tested and in a prolonged adverse scenario, deeper levels like 1000 cannot be ruled out.
अपनी कुर्सी की पेटी बांध लो, मौसम बदलने वाला है।
Retail investors are advised to reassess their positions with a clear plan in plac
Key facts today
Next report date
—
Report period
—
EPS estimate
—
Revenue estimate
—
112.10 INR
70.99 B INR
978.67 B INR
370.34 M
About Adani Enterprises Limited
Sector
Industry
CEO
Rajesh Shantilal Adani
Website
Headquarters
Ahmedabad
Founded
1988
IPO date
Sep 12, 1994
Identifiers
2
ISIN INE423A01024
Adani Enterprises Ltd. engages in the business of integrated infrastructure and trading activities. It operates through the following segments: Integrated Resource Management, Mining, Commercial Mining, New Energy Ecosystem, Airport, Road, and Others. The company was founded by Gautambhai Shantilal Adani in 1988 and is headquartered in Ahmedabad, India.
Related stocks

1960 is ideal buy price and wait for it to come It is 1960 price ideal to enter in investment.
Target : 3400
SL : 1830
Manage your Risk ..
Price is near support trendline so, if breakdown will be there it will be available to lower levels.
then we can plan to enter in buy

Adani Enterprises Adani Group Down
But we got a chance to enter at better level.
Adani Enterprises - Monthly Setup
Have marked potential SIP levels
Do your due diligence
Trendline is Monthly.
Watch carefully @ end of month close.
Just my view
Like and share
will post other group company charts as and wh

Adani Enterprises Short Term Long OppertunityWait for a bullish rejection from this area
Go and grab it.

Triangle Compression IN ADANIENTNSE:ADANIENT is squeezing toward the apex of a falling trendline and rising support.
Price is still inside compression, with no clear breakout yet. But there is a chance that it can touch 2260 level before it breaks on the upside.

ADANIENT - Falling Wedge PATTERN BREAKOUT [ BUY SIDE ]1. RSI, Supports & Resistances:
RSI (2025-11-14): 56.11
(This suggests the stock is neither overbought nor oversold—indicating moderate strength)
Current Price: ₹2516.80
Support Levels:
Support 3: ₹2510.00
Support 2: ₹2507.50
Support 1: ₹2500.00
(These are potential bounce or buying zones if t

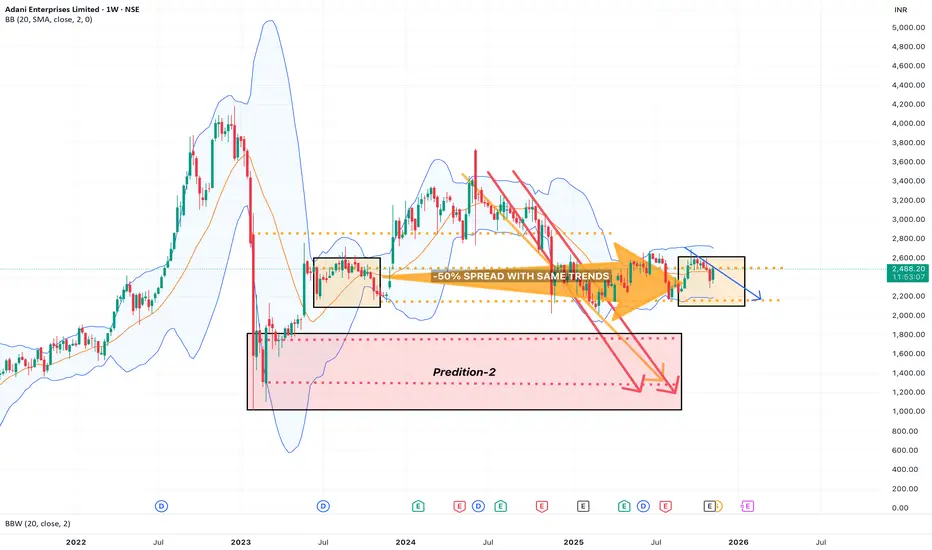
Is it same trends, or its going to be another spin ?????????Current INCPI is 197.3 form 197.2 and difference is .1 money printing inflation. Sound small but 60 rupee cost of living increase on 60% poverty is lot. So Economy burden increase the stock but how long?? End time coming closer or more money print, nothing positive for long future.
Adani Enterprises: The Bull Is Roaring Loud!This is the daily timeframe chart of Adani Enterprises.
The stock is moving within a well-defined parallel channel, with a strong support zone around the 2250–2300 range. After the recent decline, the stock respected this zone and started a fresh bullish rally from the support.
Earlier, the stock

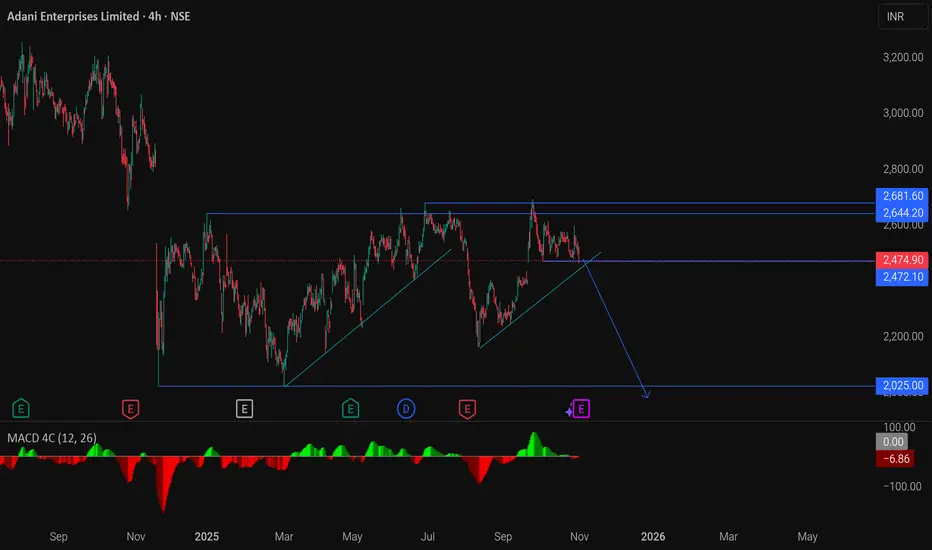
Adani enterprise ready to go to the bottom of structureI see adani enterprise breaking the top of structure and coming back down.
With good amount of accumulation i believe it is ready to go to the bottom of structure very fast.
ADANI Enterprises Ltd for 6th Oct #ADANIENT ADANI Enterprises Ltd for 6th Oct #ADANIENT
Resistance 2600-2610 Watching above 2612 for upside momentum.
Support area 2550 Below 2580 gnoring upside momentum for intraday
Watching below 2545 for downside movement...
Above 2580 ignoring downside move for intraday
Charts for Educational purpose

See all ideas
Summarizing what the indicators are suggesting.
Neutral
SellBuy
Strong sellStrong buy
Strong sellSellNeutralBuyStrong buy
Neutral
SellBuy
Strong sellStrong buy
Strong sellSellNeutralBuyStrong buy
Neutral
SellBuy
Strong sellStrong buy
Strong sellSellNeutralBuyStrong buy
An aggregate view of professional's ratings.
Neutral
SellBuy
Strong sellStrong buy
Strong sellSellNeutralBuyStrong buy
Neutral
SellBuy
Strong sellStrong buy
Strong sellSellNeutralBuyStrong buy
Neutral
SellBuy
Strong sellStrong buy
Strong sellSellNeutralBuyStrong buy
Displays a symbol's price movements over previous years to identify recurring trends.
A
10AAHL29
Adani Airport Holdings Limited 10.0% 14-MAR-2029Yield to maturity
9.06%
Maturity date
Mar 14, 2029
A
995AAHL27
Adani Airport Holdings Limited 9.95% 15-MAR-2027Yield to maturity
8.63%
Maturity date
Mar 15, 2027
A
995AAHL28
Adani Airport Holdings Limited 9.95% 12-JUN-2028Yield to maturity
8.00%
Maturity date
Jun 12, 2028
See all ADANIENT bonds
Frequently Asked Questions
The current price of ADANIENT is 2,184.60 INR — it has increased by 0.04% in the past 24 hours. Watch Adani Enterprises Limited stock price performance more closely on the chart.
Depending on the exchange, the stock ticker may vary. For instance, on NSE exchange Adani Enterprises Limited stocks are traded under the ticker ADANIENT.
ADANIENT stock has fallen by −5.00% compared to the previous week, the month change is a −1.17% fall, over the last year Adani Enterprises Limited has showed a 0.29% increase.
We've gathered analysts' opinions on Adani Enterprises Limited future price: according to them, ADANIENT price has a max estimate of 3,433.00 INR and a min estimate of 2,750.00 INR. Watch ADANIENT chart and read a more detailed Adani Enterprises Limited stock forecast: see what analysts think of Adani Enterprises Limited and suggest that you do with its stocks.
ADANIENT reached its all-time high on Dec 21, 2022 with the price of 4,064.00 INR, and its all-time low was 5.70 INR and was reached on Sep 20, 2006. View more price dynamics on ADANIENT chart.
See other stocks reaching their highest and lowest prices.
See other stocks reaching their highest and lowest prices.
ADANIENT stock is 4.17% volatile and has beta coefficient of −1.26. Track Adani Enterprises Limited stock price on the chart and check out the list of the most volatile stocks — is Adani Enterprises Limited there?
Today Adani Enterprises Limited has the market capitalization of 2.77 T, it has increased by 2.18% over the last week.
Yes, you can track Adani Enterprises Limited financials in yearly and quarterly reports right on TradingView.
Adani Enterprises Limited is going to release the next earnings report on Apr 30, 2026. Keep track of upcoming events with our Earnings Calendar.
ADANIENT earnings for the last quarter are 8.30 INR per share, whereas the estimation was 12.07 INR resulting in a −31.23% surprise. The estimated earnings for the next quarter are 2.83 INR per share. See more details about Adani Enterprises Limited earnings.
Adani Enterprises Limited revenue for the last quarter amounts to 248.20 B INR, despite the estimated figure of 245.68 B INR. In the next quarter, revenue is expected to reach 285.60 B INR.
ADANIENT net income for the last quarter is 56.27 B INR, while the quarter before that showed 31.99 B INR of net income which accounts for 75.91% change. Track more Adani Enterprises Limited financial stats to get the full picture.
Yes, ADANIENT dividends are paid annually. The last dividend per share was 1.30 INR. As of today, Dividend Yield (TTM)% is 0.06%. Tracking Adani Enterprises Limited dividends might help you take more informed decisions.
Adani Enterprises Limited dividend yield was 0.06% in 2024, and payout ratio reached 2.10%. The year before the numbers were 0.04% and 4.57% correspondingly. See high-dividend stocks and find more opportunities for your portfolio.
As of Feb 17, 2026, the company has 14.22 K employees. See our rating of the largest employees — is Adani Enterprises Limited on this list?
EBITDA measures a company's operating performance, its growth signifies an improvement in the efficiency of a company. Adani Enterprises Limited EBITDA is 140.43 B INR, and current EBITDA margin is 15.07%. See more stats in Adani Enterprises Limited financial statements.
Like other stocks, ADANIENT shares are traded on stock exchanges, e.g. Nasdaq, Nyse, Euronext, and the easiest way to buy them is through an online stock broker. To do this, you need to open an account and follow a broker's procedures, then start trading. You can trade Adani Enterprises Limited stock right from TradingView charts — choose your broker and connect to your account.
Investing in stocks requires a comprehensive research: you should carefully study all the available data, e.g. company's financials, related news, and its technical analysis. So Adani Enterprises Limited technincal analysis shows the neutral today, and its 1 week rating is sell. Since market conditions are prone to changes, it's worth looking a bit further into the future — according to the 1 month rating Adani Enterprises Limited stock shows the sell signal. See more of Adani Enterprises Limited technicals for a more comprehensive analysis.
If you're still not sure, try looking for inspiration in our curated watchlists.
If you're still not sure, try looking for inspiration in our curated watchlists.