Cup & handle , Adani portsCup & handle , Adani ports. 50% upside possible
Sharing personal view, no buy/sell recommedation
Key facts today
Next report date
—
Report period
—
EPS estimate
—
Revenue estimate
—
55.35 INR
110.92 B INR
298.72 B INR
711.90 M
About Adani Ports & Special Economic Zone Ltd
Sector
Industry
CEO
Ashwani Gupta
Website
Headquarters
Ahmedabad
Founded
1998
ISIN
INE742F01042
FIGI
BBG000L4ZJ89
IPO date
Nov 27, 2007
IPO offer price
11.19 USD
Adani Ports & Special Economic Zone Ltd. engages in the development, operation, and maintenance of port and port based related infrastructure facilities. It operates through the Port and Special Economic Zone (SEZ) Activities, and Others business segments. The Port and SEZ Activities segment involves in the infrastructure development activities. The Others segment comprises of aircraft operating income, utilities services, and container trains services. The company was founded by Gautambhai Shantilal Adani on May 26, 1998 and is headquartered in Ahmedabad, India.
Related stocks

Adani Ports LONGWith break of long term resistance and also clear break above cup and handle pattern, also retest of the resistance done today, looks really good to shoot upwards

Adani Ports: (Swing)Adani Ports: (Swing)
Look for swing action in this counter for the next few weeks.
Script has consolidated and formed a strong base near the supply zone.
Trade offers a RR of more than 1:3.
Check out my earlier views for a better understanding.
Note: Do your own due diligence before taking any

Adani Ports - 12/14 month base Breakout in ProgressAdani Ports is retesting the ₹1,485–₹1,500 zone after a 12–14-month rounding base between ₹1,050 and ₹1,500. A breakout could unlock a 30% upside potential toward ₹1,900 based on measured-move projection.
This pattern can be seen in multi timeframes (Daily and Weekly). RSI 60+;
Break below ₹1,365


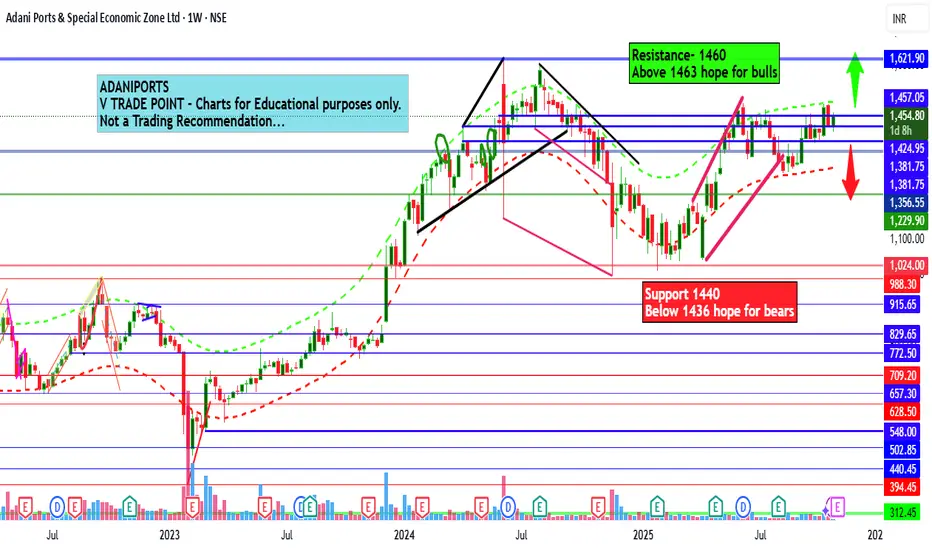
ADANIPORTS Ltd for 30th Oct #ADANIPORTS ADANIPORTS Ltd for 30th Oct #ADANIPORTS
Resistance 1460 Watching above 1463 for upside momentum.
Support area 1440 Below 1450 gnoring upside momentum for intraday
Watching below 1436 for downside movement...
Above 1450 ignoring downside move for intraday
Charts for Educational purposes only.
Pl
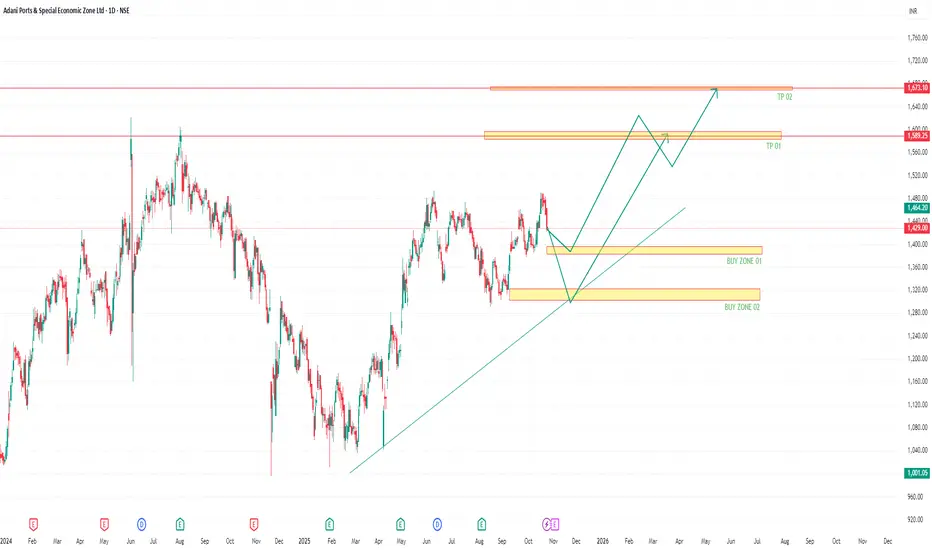
ADANI PORTS - TARGET -1589 /1673ADANI PORTS is expected to hit the levels of 1589 as per the technical analysis of the stock price movement. The price is also expected to hit the levels of 1673 in the long run.
15% - 20% is expected from the stock movement.
ADANIPORTS Ltd for 19th Sept #ADANIPORTS ADANIPORTS Ltd for 19th Sept #ADANIPORTS
Resistance 1420 Watching above 1422 for upside momentum.
Support area 1400 Below 1400 gnoring upside momentum for intraday
Watching below 1397 for downside movement...
Above 1420 ignoring downside move for intraday
Charts for Educational purposes only.
Pl

ADANI PORTS BULLISH - 1792ADANI PORTS has shown the technical to hit the levels of 1792.
The share might retrace to the levels of 1200 before flying higher.

ADANIPORTS 2Hour Time frameADANIPORTS 2-Hour Snapshot
Current Price: ₹1,388.90
Previous Close: ₹1,380.90
Day Range: ₹1,385.00 – ₹1,404.90
52-Week Range: ₹995.65 – ₹1,494.00
Volume: 2,553,605
VWAP: ₹1,392.82
Market Cap: ₹300,065 Cr
🔎 Technical Indicators
Relative Strength Index (RSI): Neutral
Moving Averages:
50-per

See all ideas
Summarizing what the indicators are suggesting.
Neutral
SellBuy
Strong sellStrong buy
Strong sellSellNeutralBuyStrong buy
Neutral
SellBuy
Strong sellStrong buy
Strong sellSellNeutralBuyStrong buy
Neutral
SellBuy
Strong sellStrong buy
Strong sellSellNeutralBuyStrong buy
An aggregate view of professional's ratings.
Neutral
SellBuy
Strong sellStrong buy
Strong sellSellNeutralBuyStrong buy
Neutral
SellBuy
Strong sellStrong buy
Strong sellSellNeutralBuyStrong buy
Neutral
SellBuy
Strong sellStrong buy
Strong sellSellNeutralBuyStrong buy
Displays a symbol's price movements over previous years to identify recurring trends.
ANRTY5230981
Adani Ports and Special Economic Zone Limited 5.0% 02-AUG-2041Yield to maturity
6.59%
Maturity date
Aug 2, 2041
ANRTY5118590
Adani Ports and Special Economic Zone Limited 3.1% 02-FEB-2031Yield to maturity
5.81%
Maturity date
Feb 2, 2031
ANRTY5231622
Adani Ports and Special Economic Zone Limited 3.828% 02-FEB-2032Yield to maturity
5.55%
Maturity date
Feb 2, 2032
ANRTY4853701
Adani Ports and Special Economic Zone Limited 4.375% 03-JUL-2029Yield to maturity
5.46%
Maturity date
Jul 3, 2029
ANRTY4517242
Adani Ports and Special Economic Zone Limited 4.0% 30-JUL-2027Yield to maturity
5.33%
Maturity date
Jul 30, 2027
ANRTY5022440
Adani Ports and Special Economic Zone Limited 4.2% 04-AUG-2027Yield to maturity
5.26%
Maturity date
Aug 4, 2027
880APSEZ34
Adani Ports and Special Economic Zone Limited 8.8% 09-JAN-2034Yield to maturity
—
Maturity date
Jan 9, 2034
775APSE40
Adani Ports and Special Economic Zone Limited 7.75% 30-MAY-2040Yield to maturity
—
Maturity date
May 30, 2040
824APSEZ26
Adani Ports and Special Economic Zone Limited 8.24% 27-NOV-2026Yield to maturity
—
Maturity date
Nov 27, 2026
822APSEZ27
Adani Ports and Special Economic Zone Limited 8.22% 08-MAR-2027Yield to maturity
—
Maturity date
Mar 8, 2027
765APSEZ27
Adani Ports and Special Economic Zone Limited 7.65% 30-OCT-2027Yield to maturity
—
Maturity date
Oct 30, 2027
See all ADANIPORTS bonds
Curated watchlists where ADANIPORTS is featured.

Indian stocks: Racing ahead
46 No. of Symbols
See all sparks
Frequently Asked Questions
The current price of ADANIPORTS is 1,505.60 INR — it has increased by 0.45% in the past 24 hours. Watch Adani Ports & Special Economic Zone Ltd stock price performance more closely on the chart.
Depending on the exchange, the stock ticker may vary. For instance, on NSE exchange Adani Ports & Special Economic Zone Ltd stocks are traded under the ticker ADANIPORTS.
ADANIPORTS stock has fallen by −0.49% compared to the previous week, the month change is a 3.78% rise, over the last year Adani Ports & Special Economic Zone Ltd has showed a 15.73% increase.
We've gathered analysts' opinions on Adani Ports & Special Economic Zone Ltd future price: according to them, ADANIPORTS price has a max estimate of 1,920.00 INR and a min estimate of 1,476.00 INR. Watch ADANIPORTS chart and read a more detailed Adani Ports & Special Economic Zone Ltd stock forecast: see what analysts think of Adani Ports & Special Economic Zone Ltd and suggest that you do with its stocks.
ADANIPORTS reached its all-time high on Jun 3, 2024 with the price of 1,621.40 INR, and its all-time low was 50.75 INR and was reached on Dec 2, 2008. View more price dynamics on ADANIPORTS chart.
See other stocks reaching their highest and lowest prices.
See other stocks reaching their highest and lowest prices.
ADANIPORTS stock is 1.27% volatile and has beta coefficient of 1.53. Track Adani Ports & Special Economic Zone Ltd stock price on the chart and check out the list of the most volatile stocks — is Adani Ports & Special Economic Zone Ltd there?
Today Adani Ports & Special Economic Zone Ltd has the market capitalization of 3.24 T, it has increased by 2.03% over the last week.
Yes, you can track Adani Ports & Special Economic Zone Ltd financials in yearly and quarterly reports right on TradingView.
Adani Ports & Special Economic Zone Ltd is going to release the next earnings report on Feb 10, 2026. Keep track of upcoming events with our Earnings Calendar.
ADANIPORTS earnings for the last quarter are 15.65 INR per share, whereas the estimation was 14.62 INR resulting in a 7.05% surprise. The estimated earnings for the next quarter are 15.27 INR per share. See more details about Adani Ports & Special Economic Zone Ltd earnings.
Adani Ports & Special Economic Zone Ltd revenue for the last quarter amounts to 91.67 B INR, despite the estimated figure of 91.28 B INR. In the next quarter, revenue is expected to reach 94.60 B INR.
ADANIPORTS net income for the last quarter is 31.09 B INR, while the quarter before that showed 33.15 B INR of net income which accounts for −6.20% change. Track more Adani Ports & Special Economic Zone Ltd financial stats to get the full picture.
Yes, ADANIPORTS dividends are paid annually. The last dividend per share was 7.00 INR. As of today, Dividend Yield (TTM)% is 0.47%. Tracking Adani Ports & Special Economic Zone Ltd dividends might help you take more informed decisions.
Adani Ports & Special Economic Zone Ltd dividend yield was 0.59% in 2024, and payout ratio reached 13.63%. The year before the numbers were 0.45% and 15.98% correspondingly. See high-dividend stocks and find more opportunities for your portfolio.
As of Dec 4, 2025, the company has 45.25 K employees. See our rating of the largest employees — is Adani Ports & Special Economic Zone Ltd on this list?
EBITDA measures a company's operating performance, its growth signifies an improvement in the efficiency of a company. Adani Ports & Special Economic Zone Ltd EBITDA is 208.54 B INR, and current EBITDA margin is 60.20%. See more stats in Adani Ports & Special Economic Zone Ltd financial statements.
Like other stocks, ADANIPORTS shares are traded on stock exchanges, e.g. Nasdaq, Nyse, Euronext, and the easiest way to buy them is through an online stock broker. To do this, you need to open an account and follow a broker's procedures, then start trading. You can trade Adani Ports & Special Economic Zone Ltd stock right from TradingView charts — choose your broker and connect to your account.
Investing in stocks requires a comprehensive research: you should carefully study all the available data, e.g. company's financials, related news, and its technical analysis. So Adani Ports & Special Economic Zone Ltd technincal analysis shows the buy rating today, and its 1 week rating is buy. Since market conditions are prone to changes, it's worth looking a bit further into the future — according to the 1 month rating Adani Ports & Special Economic Zone Ltd stock shows the strong buy signal. See more of Adani Ports & Special Economic Zone Ltd technicals for a more comprehensive analysis.
If you're still not sure, try looking for inspiration in our curated watchlists.
If you're still not sure, try looking for inspiration in our curated watchlists.