AI C3ai Imminent Takeover by Automation Anywhere? Rumors!C3 ai, once a darling of the enterprise AI space, has faced headwinds since its 2020 IPO. Founded by industry veteran Thomas Siebel, the company specializes in AI applications for industries like manufacturing, energy, and defense, offering tools for predictive maintenance, supply chain optimization
C3.ai, Inc. Class A
No trades
Next report date
—
Report period
—
EPS estimate
—
Revenue estimate
—
−2.454 EUR
−254.92 M EUR
343.53 M EUR
129.00 M
About C3.ai, Inc.
Sector
Industry
CEO
Stephen Bradley Ehikian
Website
Headquarters
Redwood City
Founded
2009
IPO date
Dec 9, 2020
Identifiers
3
ISIN US12468P1049
C3.ai, Inc. engages in the provision of enterprise artificial intelligence software for digital transformation. It delivers the C3 AI suite for developing, deploying, and operating large-scale AI, predictive analytics, and Internet of Things applications in addition to a portfolio of turn-key AI applications. It operates through the following geographical segments: North America, Europe, The Middle East, and Africa, Asia Pacific, and Rest of World. The company was founded by Thomas M. Siebel, Patricia A. House and Stephen Maurice Ward, Jr. on January 8, 2009 and is headquartered in Redwood City, CA.
Related stocks
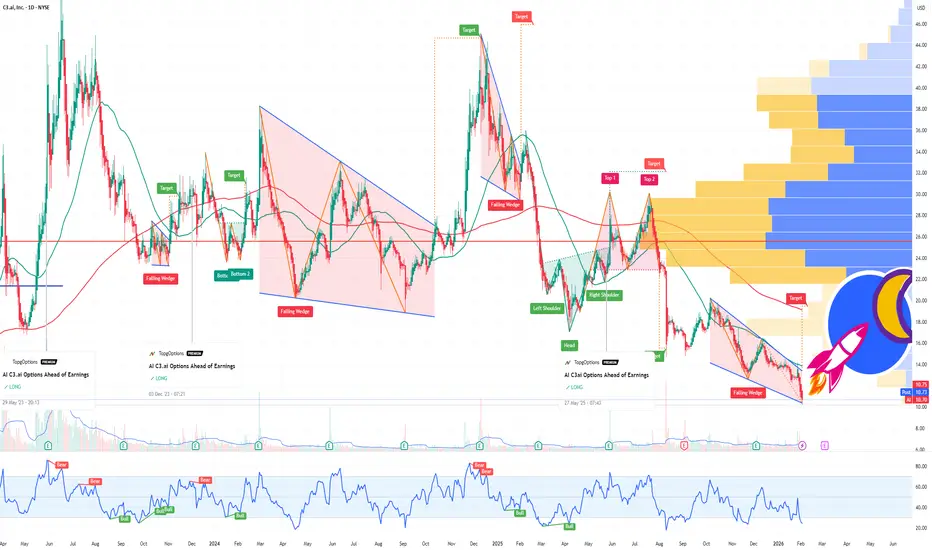
Again C3.AI - 90 % potential profit - TARGET 24 USDOn the daily chart, the stock remains in a long-term downtrend; however, downward momentum has clearly weakened in recent weeks. Price has stabilized around the 12–13 USD area, which previously acted as a demand zone. This price behavior suggests a possible accumulation phase following a prolonged d

I Found a Pattern in $AI That Shouldn’t Exist. 45–46 (late 2026)I’ve been studying NYSE:AI ’s entire 2025 price cycle, and what I found is pretty interesting.
The entire downtrend wasn’t random, it behaved like a damped harmonic oscillator.
First drop: –28
Second drop: –15
Third drop: –7
Each decline was almost exactly 50% of the previous one.
Same t

AI expanded collaboration with MSFT MicrosoftPositioning for the next wave of enterprise AI adoption, rather than the last earnings print:
1. Deepening Microsoft Integration = Real Distribution Power
The most important recent development is C3ai’s expanded collaboration with Microsoft:
C3 ai is now natively integrated across Microsoft Copilot

AI in BUY ZONEMy trading plan is very simple.
I buy or sell when at either of these events happen:
* Price tags the top or bottom of parallel channel zones
* Money flow volume spikes beyond it's Bollinger Bands
So...
Here's why I'm picking this symbol to do the thing.
Price in buying zone at bottom of channe

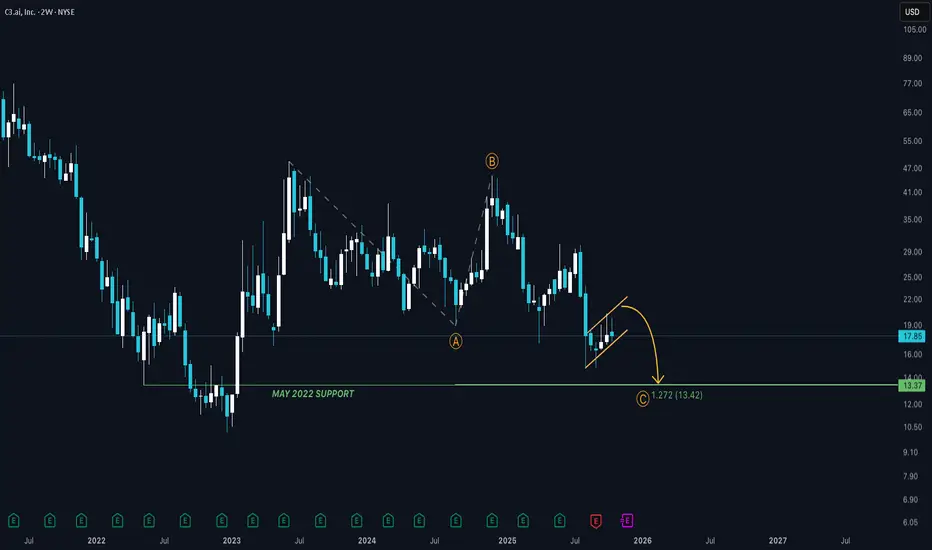
AI Final Grab IncomingNYSE:AI - AI has been forming a Wyckoff traders dream chart. This did look ready for a bounce (and still may) with the doji candle that printed at the beginning of September, but now, this ascending channel is looking bearish.
So, the ascending channel may be hinting that wave C will be bottomi
AI: From Hardship to Triumph: A Journey of ResilienceAI:
.
From Hardship to Triumph: A Journey of Resilience
.
US STOCKS- WALL STREET DREAM- LET'S THE MARKET SPEAK!
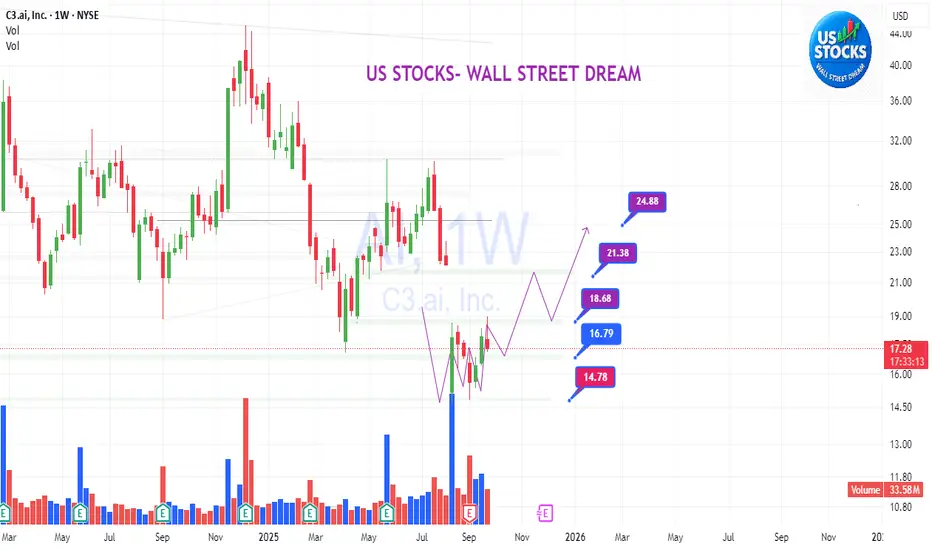
AIBullish engulfing previous bearish candlestick. Gap seen between 18.58 and 22.16. Mid level 0.5 Fib level target at $22.44. Shell Fuel is one of the partners. Entry around $18.
d3ffer8gq6olw4.cloudfront.net

SHORT | AINYSE:AI
Weekly Chart Analysis
A clear Head & Shoulders pattern has formed with neckline support around the $18.80–$18.20 zone. Price failed to hold above the 50 & 200 EMA, breaking structure from Lower Highs. Volume confirms distribution. A decisive break below neckline could open downside targe

C3.ai (AI) BUYC3.ai (AI) is a pure-play AI software provider, building customizable enterprise solutions across energy, healthcare, and manufacturing. Its volatility is high, but so is its growth potential.

See all ideas
Summarizing what the indicators are suggesting.
Neutral
SellBuy
Strong sellStrong buy
Strong sellSellNeutralBuyStrong buy
Neutral
SellBuy
Strong sellStrong buy
Strong sellSellNeutralBuyStrong buy
Neutral
SellBuy
Strong sellStrong buy
Strong sellSellNeutralBuyStrong buy
An aggregate view of professional's ratings.
Neutral
SellBuy
Strong sellStrong buy
Strong sellSellNeutralBuyStrong buy
Neutral
SellBuy
Strong sellStrong buy
Strong sellSellNeutralBuyStrong buy
Neutral
SellBuy
Strong sellStrong buy
Strong sellSellNeutralBuyStrong buy
Displays a symbol's price movements over previous years to identify recurring trends.
Frequently Asked Questions
The current price of AINC is 9.925 EUR — it has increased by 0.20% in the past 24 hours. Watch C3.ai, Inc. Class A stock price performance more closely on the chart.
Depending on the exchange, the stock ticker may vary. For instance, on VIE exchange C3.ai, Inc. Class A stocks are traded under the ticker AINC.
AINC stock has risen by 4.06% compared to the previous week, the month change is a −17.65% fall, over the last year C3.ai, Inc. Class A has showed a −69.72% decrease.
We've gathered analysts' opinions on C3.ai, Inc. Class A future price: according to them, AINC price has a max estimate of 20.25 EUR and a min estimate of 6.75 EUR. Watch AINC chart and read a more detailed C3.ai, Inc. Class A stock forecast: see what analysts think of C3.ai, Inc. Class A and suggest that you do with its stocks.
AINC reached its all-time high on Dec 10, 2024 with the price of 43.165 EUR, and its all-time low was 9.010 EUR and was reached on Feb 2, 2026. View more price dynamics on AINC chart.
See other stocks reaching their highest and lowest prices.
See other stocks reaching their highest and lowest prices.
AINC stock is 1.93% volatile and has beta coefficient of 1.80. Track C3.ai, Inc. Class A stock price on the chart and check out the list of the most volatile stocks — is C3.ai, Inc. Class A there?
Today C3.ai, Inc. Class A has the market capitalization of 1.38 B, it has decreased by −0.45% over the last week.
Yes, you can track C3.ai, Inc. Class A financials in yearly and quarterly reports right on TradingView.
C3.ai, Inc. Class A is going to release the next earnings report on Mar 4, 2026. Keep track of upcoming events with our Earnings Calendar.
AINC earnings for the last quarter are −0.22 EUR per share, whereas the estimation was −0.28 EUR resulting in a 23.58% surprise. The estimated earnings for the next quarter are −0.24 EUR per share. See more details about C3.ai, Inc. Class A earnings.
C3.ai, Inc. Class A revenue for the last quarter amounts to 65.13 M EUR, despite the estimated figure of 64.89 M EUR. In the next quarter, revenue is expected to reach 63.84 M EUR.
AINC net income for the last quarter is −90.72 M EUR, while the quarter before that showed −102.28 M EUR of net income which accounts for 11.30% change. Track more C3.ai, Inc. Class A financial stats to get the full picture.
No, AINC doesn't pay any dividends to its shareholders. But don't worry, we've prepared a list of high-dividend stocks for you.
As of Feb 11, 2026, the company has 1.18 K employees. See our rating of the largest employees — is C3.ai, Inc. Class A on this list?
EBITDA measures a company's operating performance, its growth signifies an improvement in the efficiency of a company. C3.ai, Inc. Class A EBITDA is −346.84 M EUR, and current EBITDA margin is −80.15%. See more stats in C3.ai, Inc. Class A financial statements.
Like other stocks, AINC shares are traded on stock exchanges, e.g. Nasdaq, Nyse, Euronext, and the easiest way to buy them is through an online stock broker. To do this, you need to open an account and follow a broker's procedures, then start trading. You can trade C3.ai, Inc. Class A stock right from TradingView charts — choose your broker and connect to your account.
Investing in stocks requires a comprehensive research: you should carefully study all the available data, e.g. company's financials, related news, and its technical analysis. So C3.ai, Inc. Class A technincal analysis shows the sell today, and its 1 week rating is sell. Since market conditions are prone to changes, it's worth looking a bit further into the future — according to the 1 month rating C3.ai, Inc. Class A stock shows the neutral signal. See more of C3.ai, Inc. Class A technicals for a more comprehensive analysis.
If you're still not sure, try looking for inspiration in our curated watchlists.
If you're still not sure, try looking for inspiration in our curated watchlists.