Scalp Long – AIN💎 Scalp Long – AIN
RSI shows a strong bullish divergence, with the 1H timeframe deeply oversold — signaling potential reversal momentum.
Buying volume is returning, and price is holding above key support, reinforcing the long setup.
🎯 Plan:
→ Enter after confirmation of bullish reaction at support
Related pairs

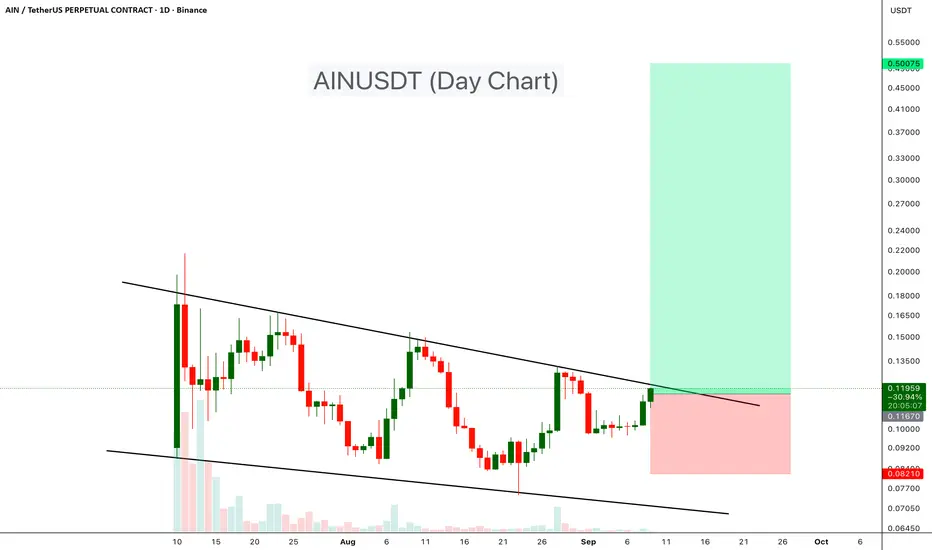
AINUSDT 1D#AIN is moving inside an ascending triangle on the daily chart. Keep an eye on it, as it’s on the verge of breaking out above the resistance zone. If that happens, the potential targets are:
🎯 $0.18233
🎯 $0.20917
🎯 $0.24328
🎯 $0.26109
🎯 $0.28668
🎯 $0.33459
⚠️ Always remember to use a tight stop-lo

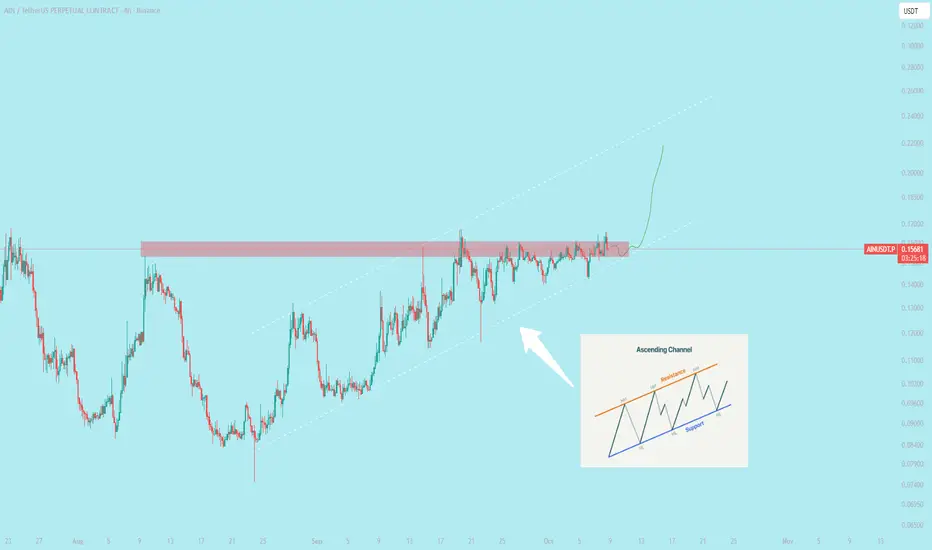
$AIN Perform Ascending Channel Pattern The ascending channel pattern is a chart formation defined by parallel rising trendlines. It signals a steady uptrend and offers clear visual rules for trade entries, targets, and risk management.
Popular across forex, equities, and crypto markets, it helps traders identify logical ranges for su
AIN PREPARING FOR BREAK OUTS One of the best charts in the current market.
Perfect accumulation tells about smart market maker.
Watching out closely , it can blast anytime

$AIN breakout confirmed above trendline, holding $0.113NYSE:AIN breakout confirmed above trendline, holding $0.113 support — eyeing $0.15–$0.20 next.

AINUSDT – Watching for a Trend ReversalAINUSDT has been trading inside a descending channel, showing consistent lower highs and lower lows. Price is now testing the upper boundary, and a breakout could open the way for a strong move higher.
- Descending Channel: Clear channel structure since mid-July.
- Current Price Action: Price is
AINUSDT.P LONGi can see some bullish momentum in the coin.
Lets hop on, dont forget to take 50% profit at 50% level and rest bring s.l to the entry.
Please guys keep supporting me by following me.
Thanks.

$AIN looks primed for a breakout. With just a $20M market cap, NYSE:AIN looks primed for a breakout. With just a $20M market cap, even a small move could send it flying. Setup here is pointing toward an easy 2–3x from these levels.

AIN ANALYSIS (12H)Before anything else, note that this is a small market cap altcoin, and if you are a swing trader, you should only trade within the red and green zones.
From the point marked with the red arrow and labeled *start* on the chart, the correction of AINUSDT has begun.
It seems to be engaged in a Diame

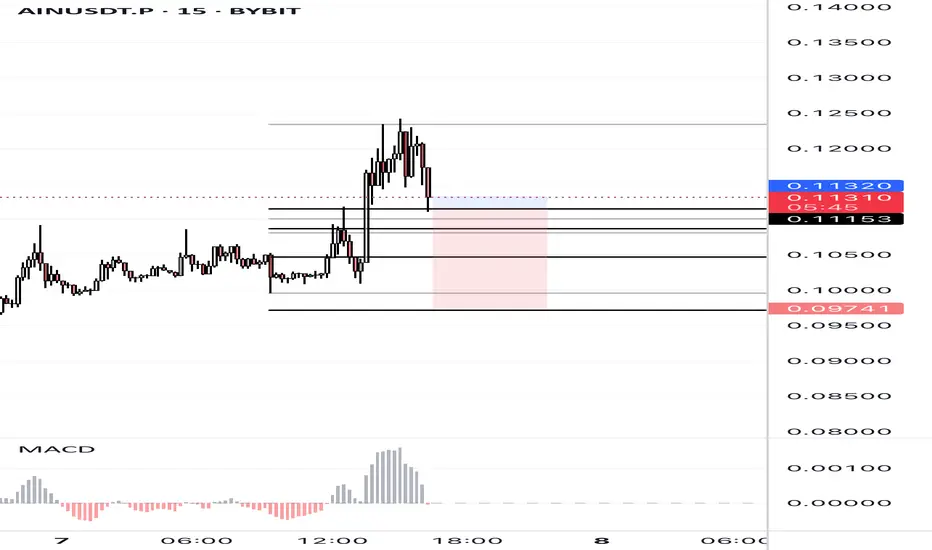
AINUSDT.P 15m – Sharp Rejection from High | Short Setup ActiveAINUSDT.P printed a strong bearish engulfing candle after hitting a local high, signaling a potential reversal. Price is now below key structure levels, and MACD shows momentum weakening after a spike.
See all ideas
Summarizing what the indicators are suggesting.
Oscillators
Neutral
SellBuy
Strong sellStrong buy
Strong sellSellNeutralBuyStrong buy
Oscillators
Neutral
SellBuy
Strong sellStrong buy
Strong sellSellNeutralBuyStrong buy
Summary
Neutral
SellBuy
Strong sellStrong buy
Strong sellSellNeutralBuyStrong buy
Summary
Neutral
SellBuy
Strong sellStrong buy
Strong sellSellNeutralBuyStrong buy
Summary
Neutral
SellBuy
Strong sellStrong buy
Strong sellSellNeutralBuyStrong buy
Moving Averages
Neutral
SellBuy
Strong sellStrong buy
Strong sellSellNeutralBuyStrong buy
Moving Averages
Neutral
SellBuy
Strong sellStrong buy
Strong sellSellNeutralBuyStrong buy
Displays a symbol's price movements over previous years to identify recurring trends.
Frequently Asked Questions
The current price of AIN / Tether USD (AIN) is 0.0012 USDT — it hasn't changed in the past 24 hours. Try placing this info into the context by checking out what coins are also gaining and losing at the moment and seeing AIN price chart.
AIN / Tether USD price hasn't changed in a week, the last month showed zero change in price, and as for the last year, AIN / Tether USD has decreased by −91.04%. See more dynamics on AIN price chart.
Keep track of coins' changes with our Crypto Coins Heatmap.
Keep track of coins' changes with our Crypto Coins Heatmap.
AIN / Tether USD (AIN) reached its highest price on Jul 25, 2025 — it amounted to 0.2617 USDT. Find more insights on the AIN price chart.
See the list of crypto gainers and choose what best fits your strategy.
See the list of crypto gainers and choose what best fits your strategy.
AIN / Tether USD (AIN) reached the lowest price of 0.0001 USDT on Aug 19, 2025. View more AIN / Tether USD dynamics on the price chart.
See the list of crypto losers to find unexpected opportunities.
See the list of crypto losers to find unexpected opportunities.
The safest choice when buying AIN is to go to a well-known crypto exchange. Some of the popular names are Binance, Coinbase, Kraken. But you'll have to find a reliable broker and create an account first. You can trade AIN right from TradingView charts — just choose a broker and connect to your account.
You can discuss AIN / Tether USD (AIN) with other users in our public chats, Minds or in the comments to Ideas.