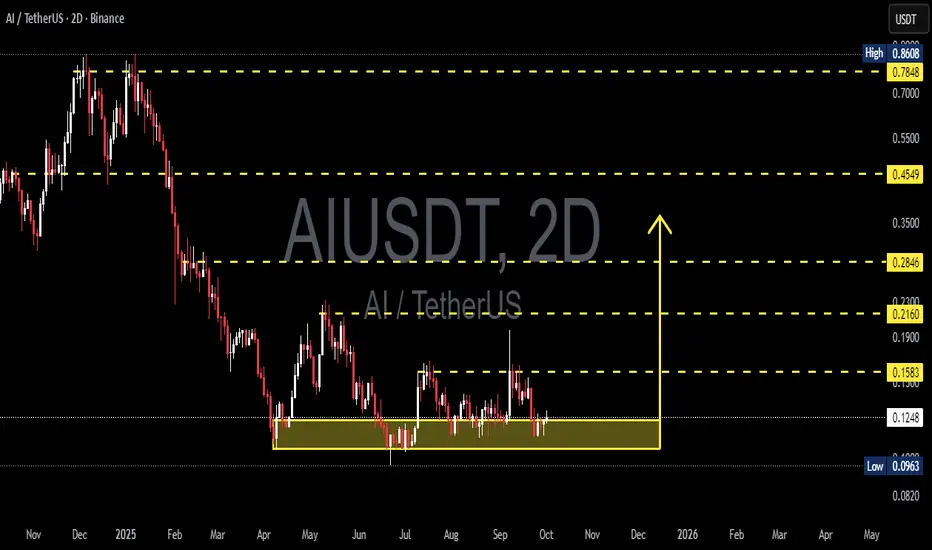
AIUSDT (2D) — Entering a Major Accumulation Phase?Overview:
AIUSDT is currently in a deep accumulation phase after a long decline from the peak at 0.8608. Price is consolidating within the critical support zone of 0.0963 – 0.1257 (highlighted in yellow). This level has been tested multiple times, showing strong interest from both buyers and sellers
Related pairs
Double Bottom!25-09-2025
Double bottom with Bullish Divergence.
Crossing the LH may lead it towards the mentioned target.

AIUSDT Formed Diamond Pattern BottomAI appears to end its sideways consolidation period and is ready to move up.
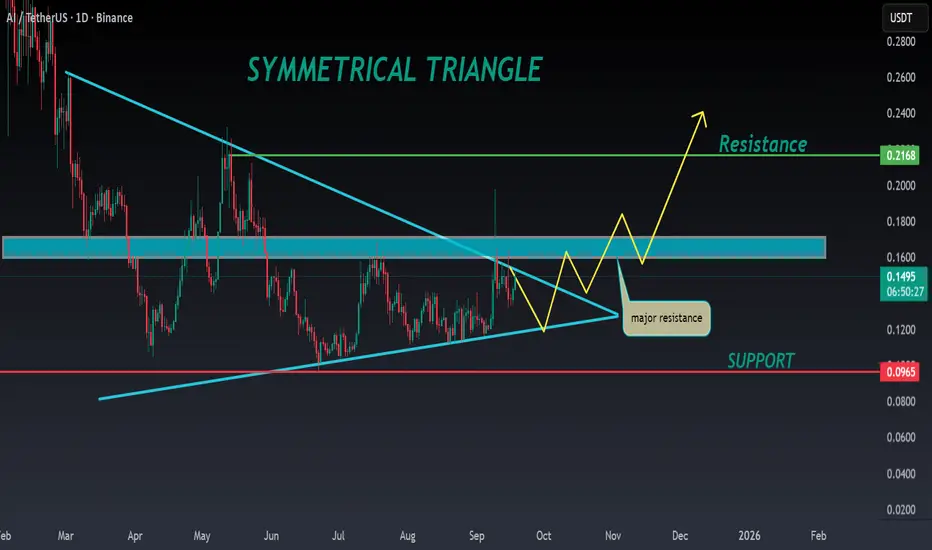
AI ANALYSIS🔮#AI Analysis 💰💰
#AI is trading in a symmetrical triangle in a weekly time frame and if it breakouts with high volume then we can see a bullish momentum in #AI. Before that we will see little bit bearish movement .
🔖 Current Price: $0.1490
⏳ Target Price: $0.2100
⁉️ What to do?
- We can trade
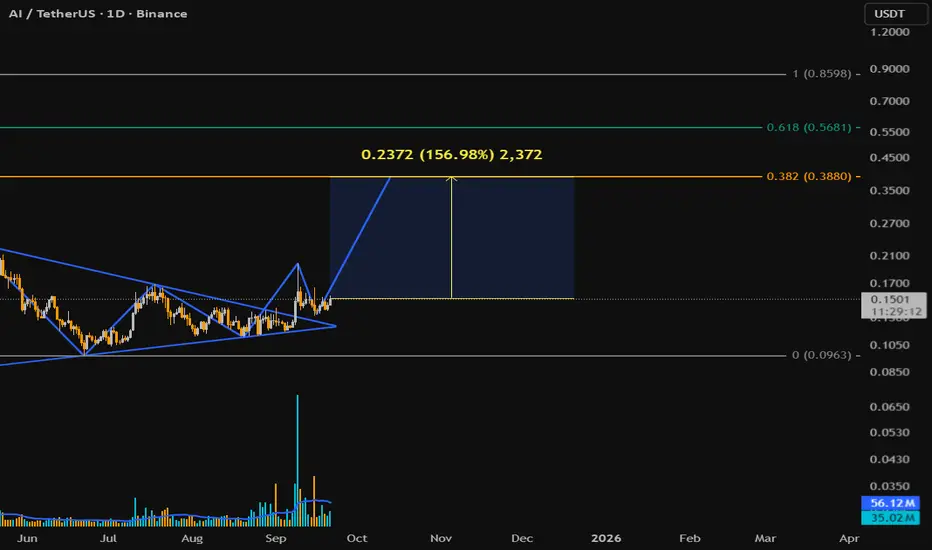
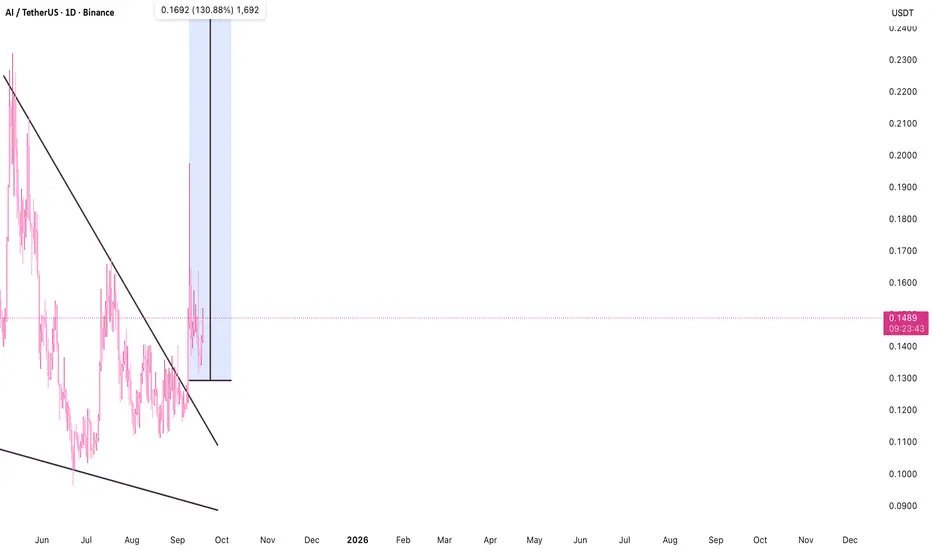
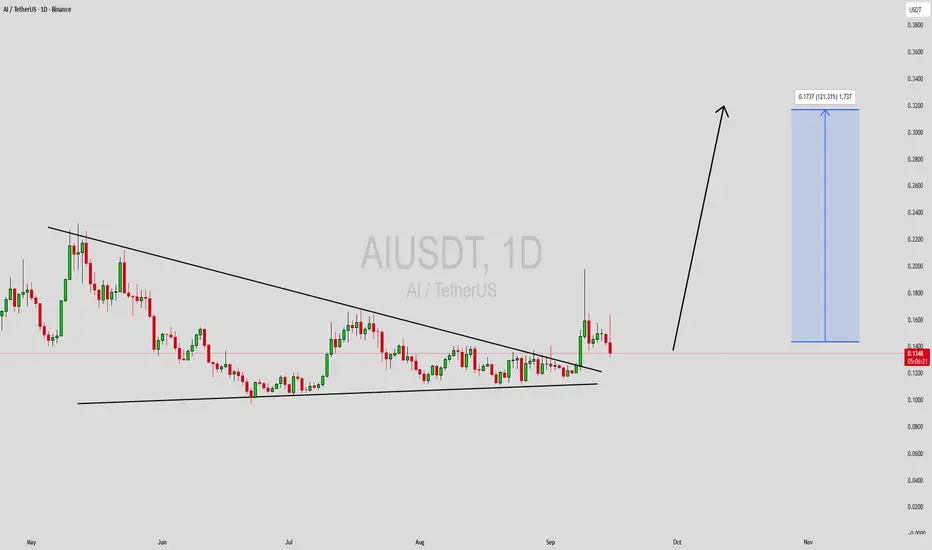
AI/USDT – Bullish Breakout: Falling Wedge Targets +130%AI has broken out of a multi-month falling wedge pattern, with confirmation from a strong daily candle closing above the descending trendline. Current price is 0.1501 USDT, showing renewed buying pressure post-breakout.
The measured move from the wedge projects a potential target near 0.30 USDT (+1
AIUSDT Forming Bullish PennantAIUSDT is currently forming a bullish pennant pattern, a continuation setup that typically signals the market is preparing for another strong upward move after an initial rally. This consolidation phase shows that buyers are holding control, with price coiling into a tighter range before a potential
AIUSDT – Consolidation at Demand Zone: Accumulation or Bearish?⏳ Current Market Context
AIUSDT is at a critical juncture, consolidating within the demand zone of $0.096 – $0.124 (yellow box). This zone has been repeatedly tested since June 2025, making it a last line of defense for buyers before a potential deeper drop.
While the macro structure remains bearis

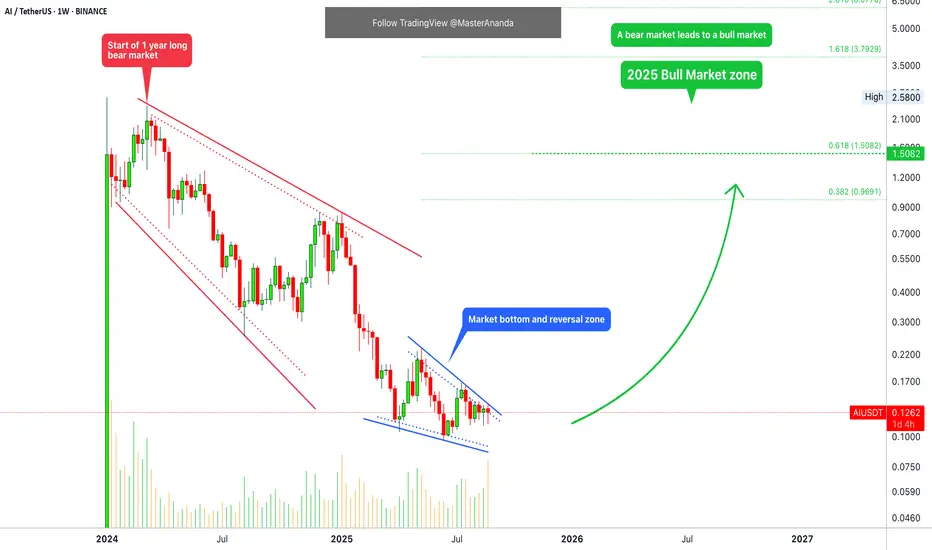
Sleepless AI · It is all in your mindSee here the chart for Sleepless AI (AIUSDT). This is long-term.
Notice the volume this week. Really high bearish volume and a red candle. Why isn't this considered a bearish signal? Because the wick low this week is higher compared to the main low in June and the previous low in April. It can also
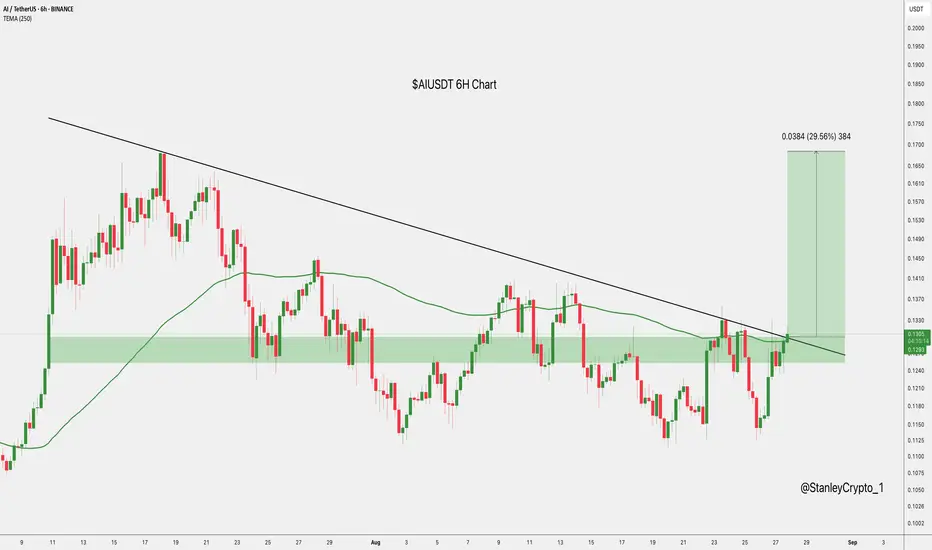
$AIUSDT Breakout: Eyeing $0.1754 NextNYSE:AI is breaking out on the 6H chart, holding steady around $0.1313 after pushing above the trendline.
If buyers keep the momentum, it could climb toward $0.1754 for a solid 30% move.
But if it slips back below $0.127, the setup could lose steam.
DYOR, NFA
$AI - LONG SETUPBINANCE:AIUSDT.P
NYSE:AI
⚠️ HIGH RISK TRADE
Recommended Leverage: 25x
🟢 LONG
Expecting the price to bounce from the white lines support.
📈 ENTRY: If 4H CC above (0.11880), DCA (0.11752)
🎯 TAKE PROFIT: Yellow Lines
🛑 STOP LOSS: 0.11616 (📊 4H Candle Close Below)
⚠️ High Risk – Manage You

See all ideas
Summarizing what the indicators are suggesting.
Oscillators
Neutral
SellBuy
Strong sellStrong buy
Strong sellSellNeutralBuyStrong buy
Oscillators
Neutral
SellBuy
Strong sellStrong buy
Strong sellSellNeutralBuyStrong buy
Summary
Neutral
SellBuy
Strong sellStrong buy
Strong sellSellNeutralBuyStrong buy
Summary
Neutral
SellBuy
Strong sellStrong buy
Strong sellSellNeutralBuyStrong buy
Summary
Neutral
SellBuy
Strong sellStrong buy
Strong sellSellNeutralBuyStrong buy
Moving Averages
Neutral
SellBuy
Strong sellStrong buy
Strong sellSellNeutralBuyStrong buy
Moving Averages
Neutral
SellBuy
Strong sellStrong buy
Strong sellSellNeutralBuyStrong buy
Displays a symbol's price movements over previous years to identify recurring trends.
Frequently Asked Questions
The current price of AI / TetherUS (AI) is 0.1257 USDT — it has fallen −4.05% in the past 24 hours. Try placing this info into the context by checking out what coins are also gaining and losing at the moment and seeing AI price chart.
AI / TetherUS price has risen by 8.73% over the last week, its month performance shows a −2.07% decrease, and as for the last year, AI / TetherUS has decreased by −66.92%. See more dynamics on AI price chart.
Keep track of coins' changes with our Crypto Coins Heatmap.
Keep track of coins' changes with our Crypto Coins Heatmap.
AI / TetherUS (AI) reached its highest price on Jan 4, 2024 — it amounted to 2.5800 USDT. Find more insights on the AI price chart.
See the list of crypto gainers and choose what best fits your strategy.
See the list of crypto gainers and choose what best fits your strategy.
AI / TetherUS (AI) reached the lowest price of 0.0300 USDT on Jan 4, 2024. View more AI / TetherUS dynamics on the price chart.
See the list of crypto losers to find unexpected opportunities.
See the list of crypto losers to find unexpected opportunities.
The safest choice when buying AI is to go to a well-known crypto exchange. Some of the popular names are Binance, Coinbase, Kraken. But you'll have to find a reliable broker and create an account first. You can trade AI right from TradingView charts — just choose a broker and connect to your account.
Crypto markets are famous for their volatility, so one should study all the available stats before adding crypto assets to their portfolio. Very often it's technical analysis that comes in handy. We prepared technical ratings for AI / TetherUS (AI): today its technical analysis shows the sell signal, and according to the 1 week rating AI shows the sell signal. And you'd better dig deeper and study 1 month rating too — it's sell. Find inspiration in AI / TetherUS trading ideas and keep track of what's moving crypto markets with our crypto news feed.
AI / TetherUS (AI) is just as reliable as any other crypto asset — this corner of the world market is highly volatile. Today, for instance, AI / TetherUS is estimated as 1.61% volatile. The only thing it means is that you must prepare and examine all available information before making a decision. And if you're not sure about AI / TetherUS, you can find more inspiration in our curated watchlists.
You can discuss AI / TetherUS (AI) with other users in our public chats, Minds or in the comments to Ideas.