ALTUSDT 1D#ALT is moving near the descending trendline and is on the verge of breaking out above it, with the daily SMA200 acting as strong support. If a breakout occurs, the potential targets are:
🎯 $0.04249
🎯 $0.04878
🎯 $0.05506
🎯 $0.06401
🎯 $0.07541
⚠️ As always, use a tight stop-loss and apply proper ri

ALT/USDT — Descending Triangle: Breakout or Breakdown?🔎 Overview
ALT/USDT has been in a prolonged downtrend since 2024, consistently forming lower highs along a descending trendline. At the same time, buyers continue to defend the support base at 0.028–0.031 USDT, creating a clear Descending Triangle pattern.
Currently, price action is consolidating
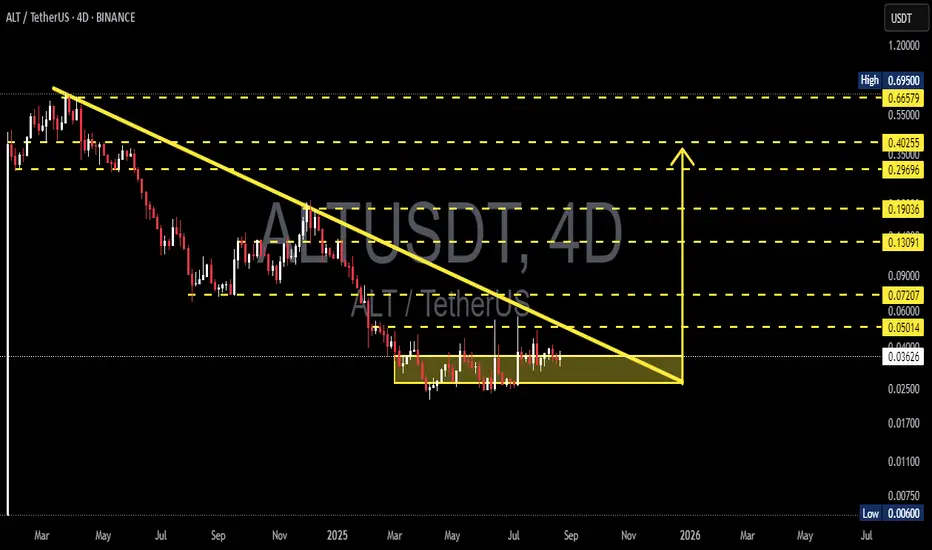
$ALT/USDT Breakout Loading"NASDAQ:ALT has been in a downtrend for a long time, but it has been quietly consolidating for months.
Now it’s pushing towards a key trendline.
If it breaks out, we could be looking at a massive move toward $0.70951, which is over 1,500% from here.
DYOR, NFA

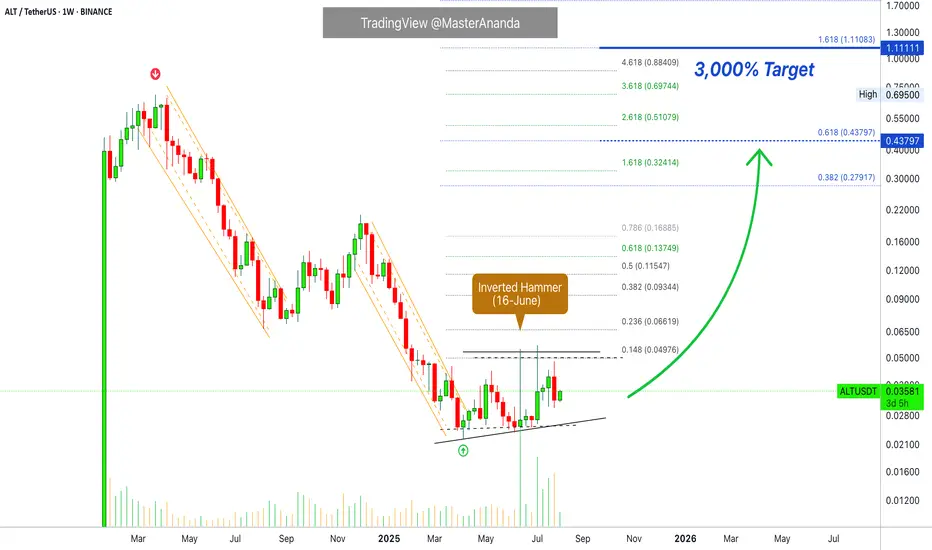
AltLayer 3,000% Late 2025 Target · Bottom ConfirmedThis is a perfect chart. You can see the same drawings made by the candles compared to other altcoins we've been visiting. For example, the main low happened 7-April 2025, four months ago. So AltLayer hit bottom and has been consolidating slowly moving up.
Notice higher lows. Notice how after more
ALT/USDT - Superbullish ALT/USDT is shaping a superbullish market structure, driven by aggressive buyer pressure and consistent demand. Price has repeatedly defended the $0.035 zone, which now stands out as a strong base support—a clear sign of accumulation and market confidence.
This level has acted as a springboard for
ALTUSDT Forming Bullish ReversalALTUSDT is currently displaying a bullish reversal pattern that may mark the beginning of a significant trend change. After a prolonged period of downward or sideways movement, the asset has shown signs of accumulation, with increasing volume and a shift in price structure. This type of reversal for

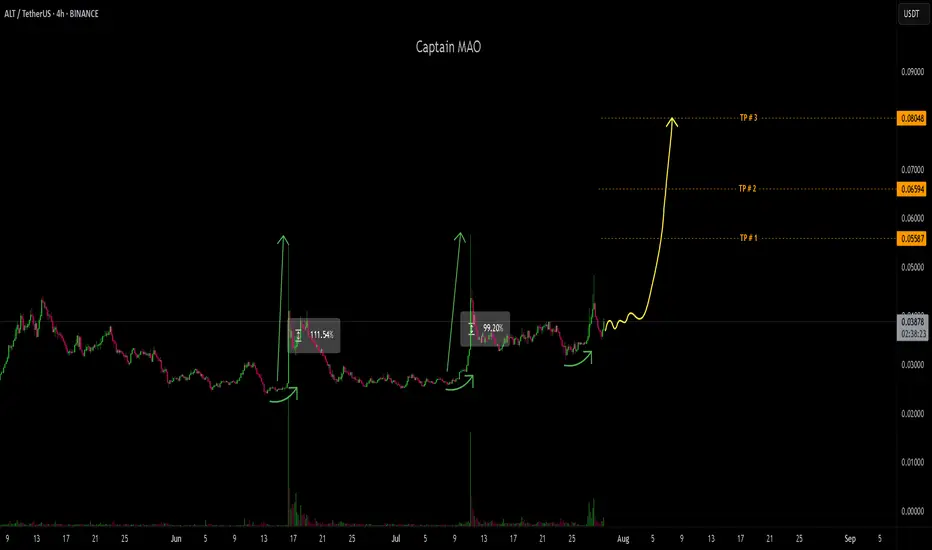
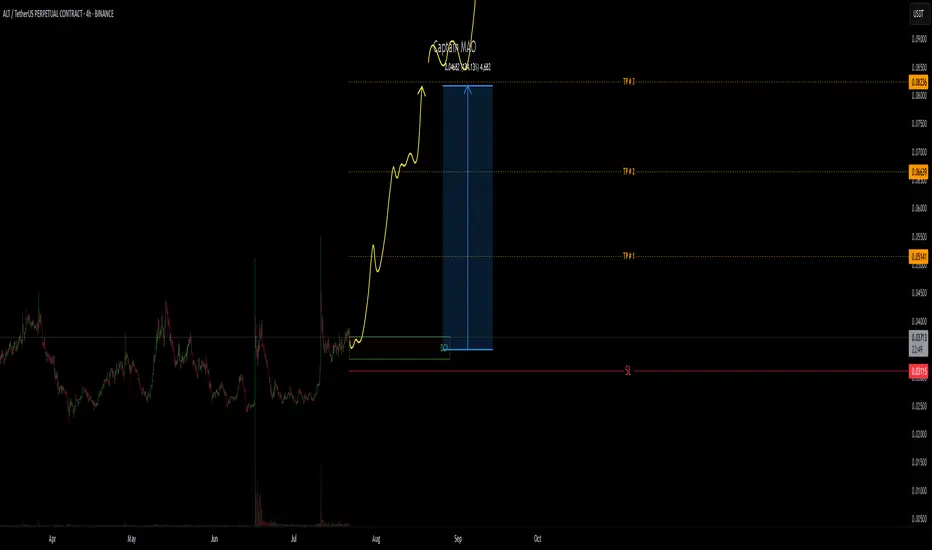
ALT/USDT - Parabolic moveis preparing for its next parabolic move. Over the past 10 days, price has established a solid base support around the $0.033 zone, consolidating in a tight range. This accumulation structure suggests that a breakout and strong upward leg could be imminent.
ALT- Trading idea.
Altlayer - emerges as a decentralized protocol designed to revolutionize the blockchain landscape by simplifying the launch of native and restaked rollups. These rollups, which can be based on optimistic or zk-rollup stacks, benefit from enhanced security, decentralization, and interoperability

ALTUSDT Forming Potential BreakoutALTUSDT is shaping up to be an interesting opportunity for crypto traders watching for potential breakout plays. The pair has recently tested a strong horizontal support zone multiple times, forming a solid base around that level. This accumulation range is a key area where buyers seem to step in ag

ALT/USDT +200%ALT recently delivered a powerful +100% pump, showcasing the strength of the $0.024 – $0.025 demand zone. After a healthy 50% retracement from the previous leg up, price action is now stabilizing and forming a new support base around the $0.025 – $0.026 zone — a classic setup for the next major move

See all ideas
Summarizing what the indicators are suggesting.
Oscillators
Neutral
SellBuy
Strong sellStrong buy
Strong sellSellNeutralBuyStrong buy
Oscillators
Neutral
SellBuy
Strong sellStrong buy
Strong sellSellNeutralBuyStrong buy
Summary
Neutral
SellBuy
Strong sellStrong buy
Strong sellSellNeutralBuyStrong buy
Summary
Neutral
SellBuy
Strong sellStrong buy
Strong sellSellNeutralBuyStrong buy
Summary
Neutral
SellBuy
Strong sellStrong buy
Strong sellSellNeutralBuyStrong buy
Moving Averages
Neutral
SellBuy
Strong sellStrong buy
Strong sellSellNeutralBuyStrong buy
Moving Averages
Neutral
SellBuy
Strong sellStrong buy
Strong sellSellNeutralBuyStrong buy
Displays a symbol's price movements over previous years to identify recurring trends.