S&P 500 Equal Weight 100% more ROI than SP500RSP | Short Setup | Equal-Weight Loss of Momentum at Channel Top | (Dec 19, 2025)
🔹 Thesis Summary
Equal-weight S&P (RSP) is stalling beneath prior highs after a failed breakout at the top of a 2-year rising channel. Breadth has softened while volume-by-price shows a heavy node below—risk skew favors a controlled fade into the mid-170s if the rejection holds.
🔹 Narrative & Context
Structure: Price was rejected inside a defined supply box at the channel ceiling. Momentum (RSI subpanel) failed to confirm new highs and keeps printing “bear” tags near ~60—classic non-confirmation.
Volume Profile: Right-side VPVR shows a thick node around 169–173; acceptance back into this area often gravitates price toward its lower boundary.
Moving Averages: Short MAs have flattened beneath the failed breakout; a rollover toward the 200D is plausible if 188 gives way.
Breadth Theme: Equal-weight underperformance vs market-cap S&P persists (historical inset on chart). If leadership remains narrow, equal-weight typically lags into pullbacks.
Sector Rotation: Cyclical/value tilt within RSP leaves it more sensitive to slowdown scares and tightening financial conditions than the megacap-heavy cap-weight index.
🔹 Valuation & Context (Pro Metrics, Framed Simply)
Forward P/E: Equal-weight tends to trade closer to mid-teens vs. higher teens/low-20s for the cap-weighted index → Investors pay less per $1 of forward earnings → If growth cools, the smaller premium offers less cushion than price action implies; it doesn’t protect against de-rating driven by weaker breadth.
Quality / Profitability: Aggregate ROE for a broad equal-weight basket is typically lower than the megacap cohort → The quality mix is more average → In a risk-off tape, lower-quality cohorts usually get sold harder.
Growth: EPS growth profile is more balanced, without the AI-heavy outliers → Less narrative support on disappointments → Weak hands exit faster on technical breaks.
Risk: Debt/Equity is more heterogeneous across constituents → Uneven balance-sheet quality → Under rising real yields, dispersion widens—favors the short when the index loses trend.
🔹 Contrarian Angle (Your Edge)
Consensus still leans on “soft-landing breadth catch-up.” The chart argues the opposite near-term: failed breakout, momentum divergence, and a fat volume shelf below. If 188 breaks with volume, a swift air-pocket to 181/172 is on the table—contrary to the “breadth revival” narrative.
🔹 Risks
Sudden breadth thrust (financials/industrials bid) squeezes equal-weight back above 201–203.
Policy dovishness or disinflation surprise compresses risk premiums and lifts cyclicals.
Seasonality/flows (rebalance, CTA re-engagement) overwhelm the technicals.
🔹 Macro Considerations
Watch rates & USD: falling yields/weak DXY would undercut the short.
NQ vs RSP spread: if megacap leadership pauses without breadth cracking, downside follow-through may be slower.
Event risk: CPI/PCE, payrolls, and Fed communications; large options expiries that can flip dealer positioning around 190–195.
🔹 Bottom Line
RSP is rejecting at supply with deteriorating momentum and a pull-to-value below. With risk defined above 201–203, the short offers attractive asymmetry toward 181 → 172 → 169 if breadth fails to re-accelerate.
🔹 Forward Path
If this post gets traction, I’ll publish a weekly-chart follow-up with updated levels, breadth metrics, and the NQ:RSP ratio read.
Like & Follow for structured ideas, not signals. I post high-conviction setups here before broader narratives play out.
⚠️ Disclaimer: This is not financial advice. Do your own research. Charts and visuals may include AI enhancements.
🔹 Footnote
Forward P/E: Price divided by expected earnings over the next 12 months. Lower = cheaper relative to profits.
P/FCF (Price-to-Free-Cash-Flow): Price vs. the cash left after investments. A measure of efficiency.
FCF Yield: Free cash flow per share ÷ price per share. Higher = more cash returned for each dollar invested.
ROE (Return on Equity): Net income ÷ shareholder equity. Shows management efficiency with investor capital.
ROIC (Return on Invested Capital): Net income ÷ all invested capital (equity + debt). A purer profitability gauge.
Debt/Equity: Debt divided by equity. <1 usually means balance sheet is conservative.
R:R (Risk-to-Reward): Ratio of expected upside vs. downside. 3:1 = you risk $1 to make $3.
Market insights

How $450 a Month Can Turn Into $1 Million (If You Do It Right)If we reach 10+ LIKE I will do an Update!!!!!!!!!!!!
💡 Watch till the end to see how $450 a month can realistically grow over 30 years when you apply professional risk management and compounding math.
Ray Dalio Strategy is also covered
Most people invest without a plan. Professionals don’t.
In this video, we break down how to design and backtest a real investment portfolio using Portfolio Visualizer, Monte Carlo simulations, and key risk-return metrics like ROI, Sharpe Ratio, and Sortino Ratio. You’ll see how different strategies perform over time, from the classic 60/40 and 70/30 bond strategies to Ray Dalio’s Season.
We’ll cover:
What Sharpe and Sortino ratios actually tell you
How to use Portfolio Visualizer for realistic backtests
How to read Monte Carlo simulations and understand risk
How bonds, stocks, and alternative assets behave in different markets
Which strategies hold up best through inflation, recessions, and volatility
The difference between chasing returns and building durability
If you’ve ever wondered:
“Where do I start with ETFs?”
“How do I analyze a portfolio properly?”
“Which mix gives the best long-term results?”
This video gives you a clear framework to think like a professional, even if you’re managing your own money.
Tools mentioned:
Portfolio Visualizer • Monte Carlo Simulation • Sharpe Ratio Calculator • Ray Dalio All-Weather Template
Disclaimer:
This content reflects personal market opinions and is shared for educational and informational purposes only. It does not constitute financial, investment, or trading advice. Always conduct your own research and assess your risk before making any investment decisions. Past performance is not indicative of future results.

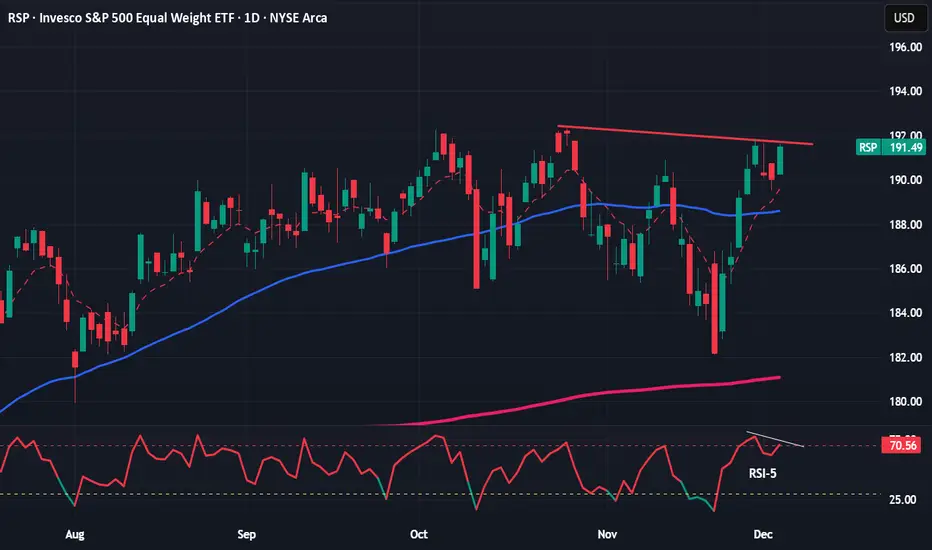
Swing Trading CycleTo successfully navigate swing trading cycles, focus on aligning your trades with the market's prevailing rhythm, prioritizing risk management, adhere to your playbook, and maintaining emotional discipline.
Daily RSI-5 is one of several tools I use to best gauge the Market's cycle for my swing trades. We want to start looking for new positions when the indictor dips below 50 on strong trends and below 30 on sideway/weak trend. Stock leaders tend to start making their up move ahead of the other regular stocks, so stick with the top 20% leading stocks.
Gold is overbought, so wait for pull backs. QQQE is under 50 now to look for new longs. IWM is slowly coming down, but not under 50 yet. If we can get both RSP and QQQE both under 50, then that would be the ideal condition.

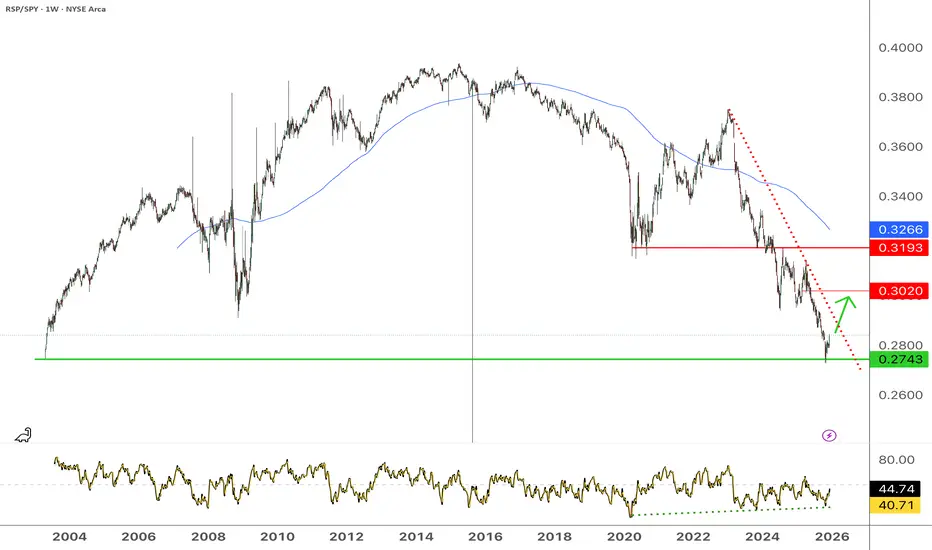
US large caps starting to underperform (RSP/SPY)S&P500 Equal weight / S&P500 (RSP/SPY) has rebounded from the 0.27 level, corresponding from its low in 2003. Expecting a rise towards at least 0.30, possibly even 0.319, as long as the low is holding. Therefore large caps tech stocks should underperform the index over the next few months.
Market Outlook: RSPBenjamin Graham describes the patient investor as someone with courage who buys when others are selling. I'm still Bullish long term, but expecting a pullback before getting into new positions. I'm looking for the RSI-5 to dip below the 30-line to look for new longs. Cheers!
Markets: Patience "The stock market is a device to transfer money from the impatient to the patient." — Warren Buffett
I'm still Bullish, but looking for a pullback to add new positions. If you look at the daily RSI-5 charts below, they are all on the extended area. This is one of several tools I use to help to look for short term swing trading. So for now the game is to be patience for the next few days. Cheers.

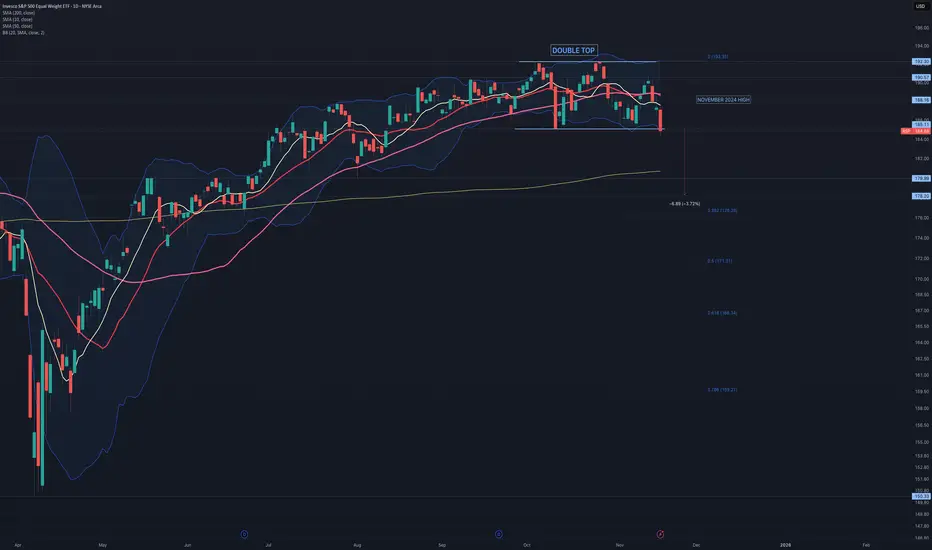
$RSP: Double TOP formation It is concerning that AMEX:RSP has formed a double top. If confirmed, the target price is set at 178. A breakdown of AMEX:RSP will face no obstacles until reaching 180, which is a demand zone and coincides with the rising 20-day simple moving average.
$RSP S&P 500 Equal Weight ETF – Trading Range AnalysisOverview
Since June 24th, I have maintained a position in the RSP S&P 500 Equal Weight ETF. My decision to enter this position was based on two primary factors. First, the ETF had consolidated following a significant upward move from its previous bottom, presenting an attractive risk-reward opportunity for a stop-loss placement. Second, I anticipated that the ongoing bull market would broaden, benefiting a wider array of stocks. As an equal weight ETF, RSP offers exposure to smaller companies that could potentially deliver larger gains. This approach also serves to diversify risk across numerous companies.
Current Trading Range
Beginning in mid-August, RSP appears to have entered a trading range, with its price movement predominantly sideways since then. Despite this period of consolidation, I remain optimistic that, should the bull market continue, RSP will eventually break out above its current range.
Position Management Strategy
At present, my allocation to RSP is at its usual full position size. However, I am prepared to increase my exposure and potentially oversize the position if the ETF breaks above the trading range, which would occur around the $192.00 level. For those considering a new position, it may be prudent to wait for a close above the 50-day moving average (DMA), as indicated by the red line. This setup could present a favorable risk-reward scenario, with a stop placed below the most recent low.
Considerations for Traders
Although RSP is not currently offering a setup that meets the criteria for action within this trading strategy, it may be worthwhile to add the ETF to your watchlist. It is important for all readers to conduct their own analysis and consistently adhere to their personal trading rules. Remember, all investments carry inherent risk, and making informed decisions is essential when allocating capital.

$RSP:TIME TO TAKE THE STAGEMoving forward, it will be essential to monitor the strength of the Equal Weight SP:SPX ETF. For the market to maintain its upward trend, broad participation is necessary. While bears may perceive a Double Top pattern, I see that the MACD is close to triggering a buy signal, and the 14-day RSI has recovered above the 50 line.

S&P 500 Extreme Breadth Reading! Caution!Why It Matters
Strong breadth = healthy rally, broad participation → more sustainable trend.
Weak breadth = top-heavy rally, fragile momentum → prone to correction.
Think of it like an airplane:
If all four engines (hundreds of stocks) are pushing, you can climb easily.
If one engine (a few mega-caps) is doing all the work, you can stay aloft — but not for long!
CAUTION! is in order!
Click boost, follow, comment nicely for more authentic, no BS, raw analysis. Let's get to 6,000 followers. ))

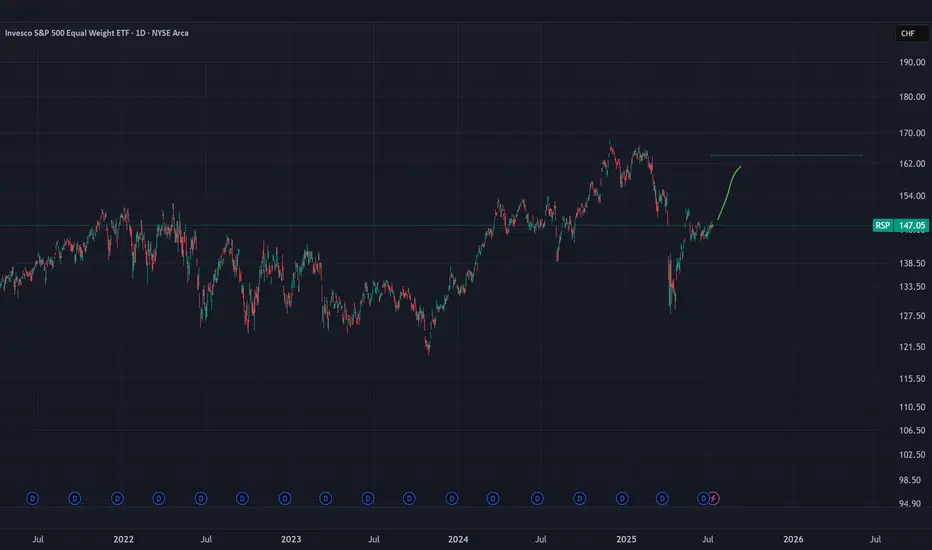
SP500 but equal weighted and in a strong CHF currencythis is the much much better index to follow as it isnt swayed by 10% moves in tesla or NVIDIA and also isnt tricked by USD dollar devaluation ;)
this is the real international index to follow
Longterm S&P 500 Equal weight.The long-term Elliott Wave pattern appears to be approaching completion, and primary Wave 5 could be an ending diagonal.
This formation suggests a significant reversal down to the start of the E.D, which would be around the COVID low. This would be only be Wave A in a larger bearish pattern.

I'm betting on the rise of the S\&P 500, therefore I'm betting oWe broke through the local level and are confidently moving toward the all-time high.
We are also above all moving averages, which gives us additional confidence in our trade.

RSP Spiral cycle peak 5/16 EXIT The chart posted is the RSP SP 500 EQUAL WEIGHTED the two high based on spirals are due to peak on Friday late . We should have a short term top and the begin a pullback for wave 4 . Best of trades WAVETIMER

Market OutlookMarkets looking a little over extended and would be normal to see a pull back soon before resuming to the upside.

Selling America - Buying EUThis is a long term trend analyzing the US market from the perspective of foreign investors. Not valuing the S&P500 500 in USD. Instead, valuing the S&P500 in multiplies of the European Stoxx 600. A multi-year trend of the US outperforming the EU has been broken.

#RSP and a simple parallel channel give a hope for the next weekHi there!
What a ride! I believe it’s a good thing that the market is closed for the weekend—I need to recharge my battery.
Today's thoughts:
If we draw a parallel channel on #RSP, which is equally structured by weight, we can observe that the price has touched the lower line.
This means that, theoretically, the price could hold here and reverse in the next week (or weeks), as it did in October 2023. Alternatively, it may not hold and could move down further, similar to what happened in 2020.
My point here is that the hysterical sell-off is near its end. The question remains: how much more pain will the Bulls endure before the reversal begins?
Happy weekend!

RSP and WHY I AM BULLISH STILL197/199 target The chart posted is the sp 500 equal weighted RSP has dropped to a trend line dated back to march 23 2020 . I have three clean points and all are major . Elliot Wave calls for a final 5th wave to end this advance in the area of 198 plus or minus 1.25 Fib relationship and PUT /CALL as well as most of my spiral and cycles point to the final advance to a Bull market top is now setup . BULL MARKETS TOP ON GOOD NEWS > Best of trades WAVETIMER

Time for equal weight?Seems to be that the equal weight S&P is going to breakout against the S&P. An outperformance of rsp is essentially a value vs growth trade. We will see in the coming weeks how this plays out

Market Going UPWe have been doing a cup and handle pattern for a long time...
The RSP shows you what the general market is doing unweighted and less distorted.
We have been experiencing much downfalls in the previous weeks in the BIG STOCKS,
but the rest of the market was not impacted...
This means...
Someone painted the market red... while buying the whole market...
Volume also seems to confirm more bullish bias than bearish bias.


RSP/SPYRSP equal weighted SP500 broke above downtrend line and has been consolidating bullishly. Market breadth is expanding, which is good for long term, however, mega caps may be under performing going forward.

Gap Fill Incoming Likely on RSPIf we take out last Fridays candle this gap fill would be the next actionable trade on AMEX:RSP aka Equal Weight AMEX:SPY
