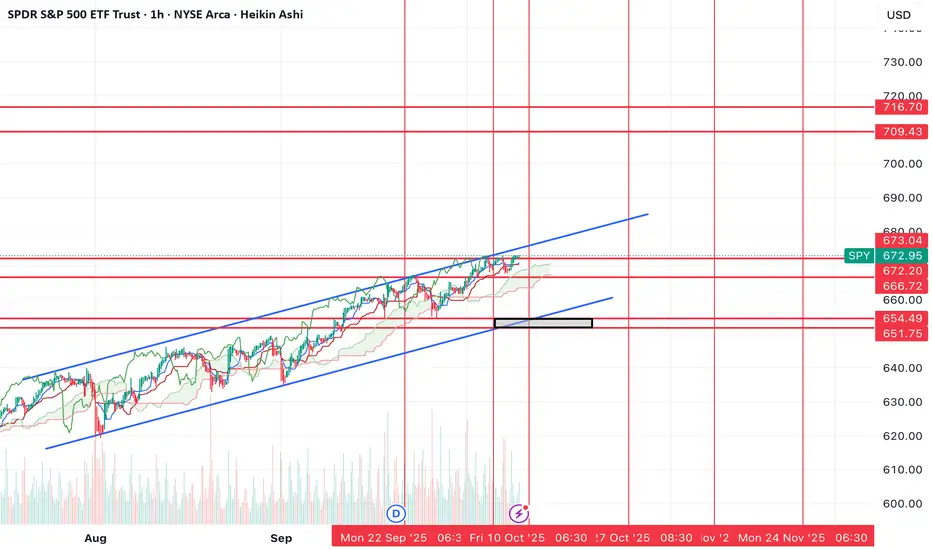
2-3% selloff incoming? Down to $651-655? Then BTD to $700+We've finally hit my target of $672 and while I still think we'll get downside after hitting this target, I don't think the sell will be as dramatic (yet).
I know everyone got bulled up after the price action today, but I think it's wise to be cautious here. Both the chart and the flows are telli
Key stats
About SPDR S&P 500 ETF Trust
Home page
Inception date
Jan 22, 1993
Structure
Unit Investment Trust
Replication method
Physical
Dividend treatment
Distributes
Distribution tax treatment
Qualified dividends
Income tax type
Capital Gains
Max ST capital gains rate
39.60%
Max LT capital gains rate
20.00%
Primary advisor
SSgA Funds Management, Inc.
Distributor
ALPS Distributors, Inc.
ISIN
US78462F1030
SPDR S&P 500 ETF Trust is an Exchange traded fund. The fund seeks to provide investment results that, before expenses, correspond generally to the price and yield performance of the S&P 500® Index. The S&P 500® Index is composed of five hundred selected stocks. SPDR S&P 500 ETF Trust was founded on January 22, 1993 and is headquartered in New York, NY.
Related funds
Classification
What's in the fund
Exposure type
Electronic Technology
Technology Services
Finance
Stock breakdown by region
Top 10 holdings
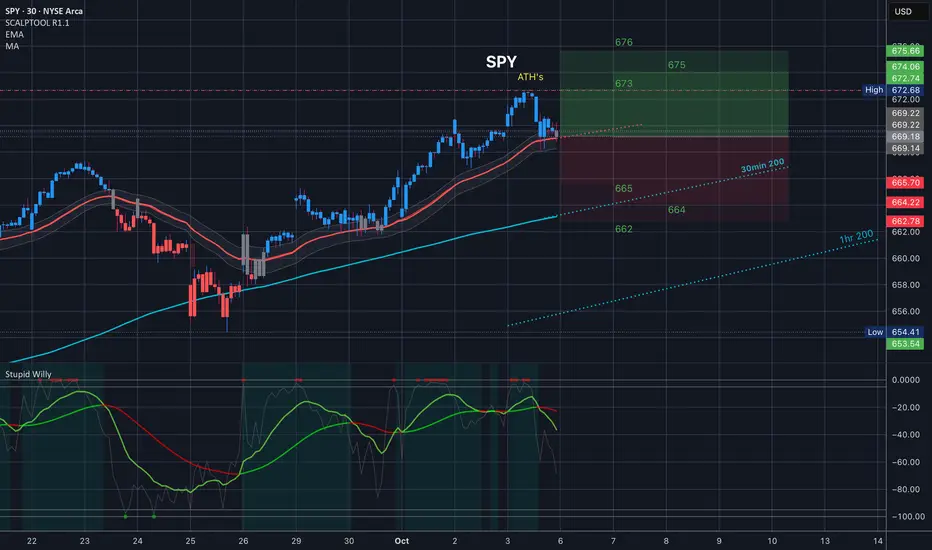
$SPY Tomorrow's Trading range 10.6.25
We closed right at the 35EMA so that is righ in the middle and will be a key level. 30min 200MA is just underneath the bottom of the implied move so if for whatever reason we come near it look to it as a support to pop us back into the implies move. And of course above us we have ATH's.
Just .
SPY: Walking a fine lineIts been a while since I have done a comprehensive written post, mostly because I don't generally have much to talk about.
But buckle up buttercups because its going to be a long one. I got lots to talk about.
Everyone's favourite little SPY. Or, as I like to call it as of this year, this abomin

Bias stays upWe may pullback with the Fomc Minutes today but a test of the low with a bullish divergence on the RSI may be all that is needed to head up to new highs. The Vix is also at a decision point.

$SPY Near Term Downtrend Confirmed
The Sell signal that we got on Friday was confirmed resistance.
Keep an eye on 671 for resistance / bear call spreads - and look to 30min 200 for support for now

Trump tariff was as a cover.Look at SPDR CME gaps it was one open and it wicked exactly to it. They used Trump tariff was as a cover.

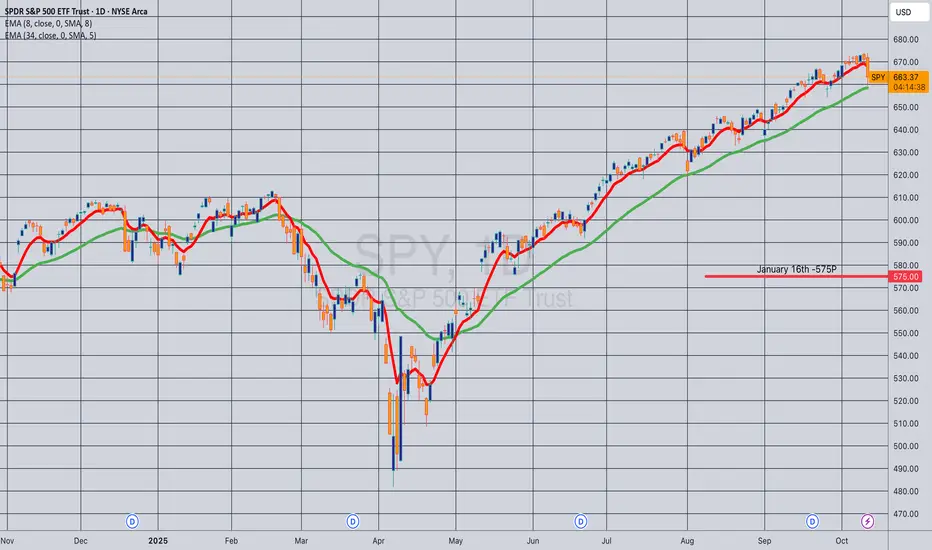
Opening (IRA): SPY January 16th -575P... for a 5.94 credit.
Comments: Laddering out ... . Targeting the strike paying around 1% of the strike price in credit. Will look to add at intervals, assuming I can get in at strikes/break evens better than what I currently have on and/or roll out short put at 50% max.
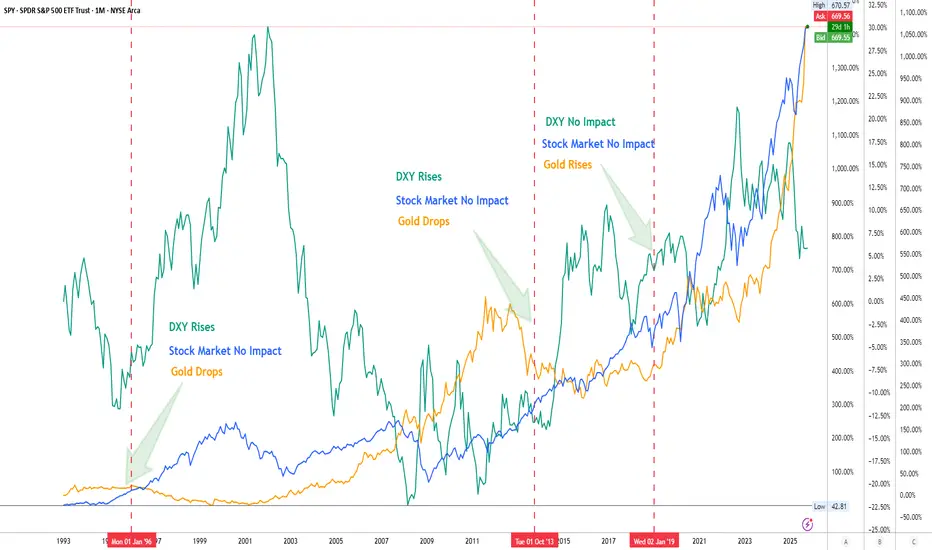
US Gov Shutdowns History: The Real ImpactLooking back at history:
-When DXY tend to rise with or after shutdowns
-Gold often drops while the stock market shows little impact.
Across 1996, 2013 & 2019 shutdowns, SP500 kept climbing, proving markets are more resilient than the headlines suggest.
Takeaway: Shutdowns = volatility noise. Lon
SPY Coiling Below Gamma Wall — Volatility Loading Into Oct. 6 Market Overview (15-Min Chart)
SPY finished Friday consolidating within a tight descending channel after a strong early session rejection from $672.60–$673, forming a potential bullish flag structure. Price action shows a short-term base developing near $669, with visible liquidity defense and lowe

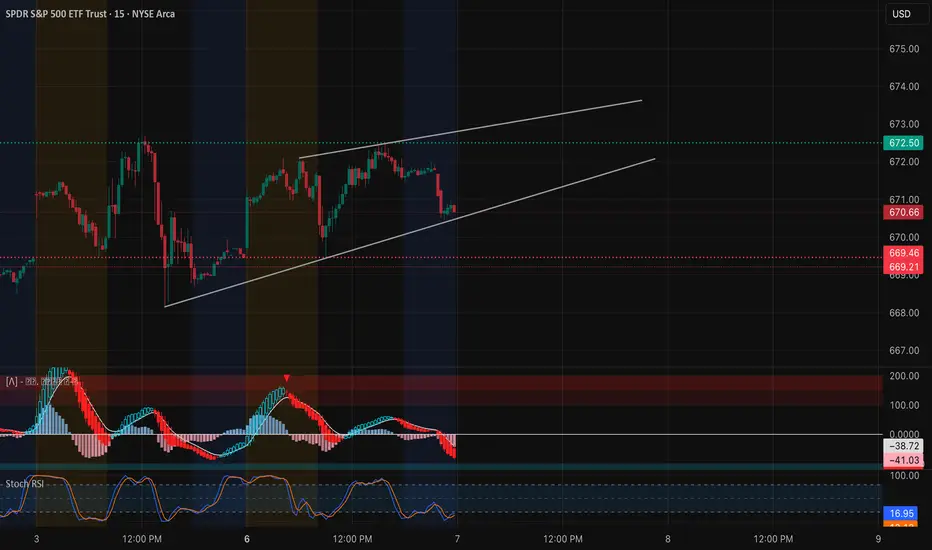
SPY Oct 7 – Bulls Defending the Channel! Watch $672 for Confirm15-Min Chart Analysis (Intraday Trading Setup):
SPY is holding a clean ascending channel structure, consolidating near $670.66 after a mild pullback from the upper resistance zone around $672.50. This intraday pattern shows controlled bullish momentum with shallow retracements — a healthy signal f
See all ideas
Summarizing what the indicators are suggesting.
Oscillators
Neutral
SellBuy
Strong sellStrong buy
Strong sellSellNeutralBuyStrong buy
Oscillators
Neutral
SellBuy
Strong sellStrong buy
Strong sellSellNeutralBuyStrong buy
Summary
Neutral
SellBuy
Strong sellStrong buy
Strong sellSellNeutralBuyStrong buy
Summary
Neutral
SellBuy
Strong sellStrong buy
Strong sellSellNeutralBuyStrong buy
Summary
Neutral
SellBuy
Strong sellStrong buy
Strong sellSellNeutralBuyStrong buy
Moving Averages
Neutral
SellBuy
Strong sellStrong buy
Strong sellSellNeutralBuyStrong buy
Moving Averages
Neutral
SellBuy
Strong sellStrong buy
Strong sellSellNeutralBuyStrong buy
Displays a symbol's price movements over previous years to identify recurring trends.
Frequently Asked Questions
An exchange-traded fund (ETF) is a collection of assets (stocks, bonds, commodities, etc.) that track an underlying index and can be bought on an exchange like individual stocks.
SPY trades at 653.02 USD today, its price has fallen −2.70% in the past 24 hours. Track more dynamics on SPY price chart.
SPY net asset value is 653.02 today — it's risen 0.40% over the past month. NAV represents the total value of the fund's assets less liabilities and serves as a gauge of the fund's performance.
SPY assets under management is 679.71 B USD. AUM is an important metric as it reflects the fund's size and can serve as a gauge of how successful the fund is in attracting investors, which, in its turn, can influence decision-making.
SPY price has fallen by −0.09% over the last month, and its yearly performance shows a 13.42% increase. See more dynamics on SPY price chart.
NAV returns, another gauge of an ETF dynamics, have risen by 0.40% over the last month, showed a 4.62% increase in three-month performance and has increased by 14.51% in a year.
NAV returns, another gauge of an ETF dynamics, have risen by 0.40% over the last month, showed a 4.62% increase in three-month performance and has increased by 14.51% in a year.
SPY fund flows account for −2.82 B USD (1 year). Many traders use this metric to get insight into investors' sentiment and evaluate whether it's time to buy or sell the fund.
Since ETFs work like an individual stock, they can be bought and sold on exchanges (e.g. NASDAQ, NYSE, EURONEXT). As it happens with stocks, you need to select a brokerage to access trading. Explore our list of available brokers to find the one to help execute your strategies. Don't forget to do your research before getting to trading. Explore ETFs metrics in our ETF screener to find a reliable opportunity.
SPY invests in stocks. See more details in our Analysis section.
SPY expense ratio is 0.09%. It's an important metric for helping traders understand the fund's operating costs relative to assets and how expensive it would be to hold the fund.
No, SPY isn't leveraged, meaning it doesn't use borrowings or financial derivatives to magnify the performance of the underlying assets or index it follows.
In some ways, ETFs are safe investments, but in a broader sense, they're not safer than any other asset, so it's crucial to analyze a fund before investing. But if your research gives a vague answer, you can always refer to technical analysis.
Today, SPY technical analysis shows the sell rating and its 1-week rating is buy. Since market conditions are prone to changes, it's worth looking a bit further into the future — according to the 1-month rating SPY shows the buy signal. See more of SPY technicals for a more comprehensive analysis.
Today, SPY technical analysis shows the sell rating and its 1-week rating is buy. Since market conditions are prone to changes, it's worth looking a bit further into the future — according to the 1-month rating SPY shows the buy signal. See more of SPY technicals for a more comprehensive analysis.
Yes, SPY pays dividends to its holders with the dividend yield of 1.11%.
SPY trades at a premium (0.00%).
Premium/discount to NAV expresses the difference between the ETF’s price and its NAV value. A positive percentage indicates a premium, meaning the ETF trades at a higher price than the calculated NAV. Conversely, a negative percentage indicates a discount, suggesting the ETF trades at a lower price than NAV.
Premium/discount to NAV expresses the difference between the ETF’s price and its NAV value. A positive percentage indicates a premium, meaning the ETF trades at a higher price than the calculated NAV. Conversely, a negative percentage indicates a discount, suggesting the ETF trades at a lower price than NAV.
SPY shares are issued by State Street Corp.
SPY follows the S&P 500. ETFs usually track some benchmark seeking to replicate its performance and guide asset selection and objectives.
The fund started trading on Jan 22, 1993.
The fund's management style is passive, meaning it's aiming to replicate the performance of the underlying index by holding assets in the same proportions as the index. The goal is to match the index's returns.