Trade ideas

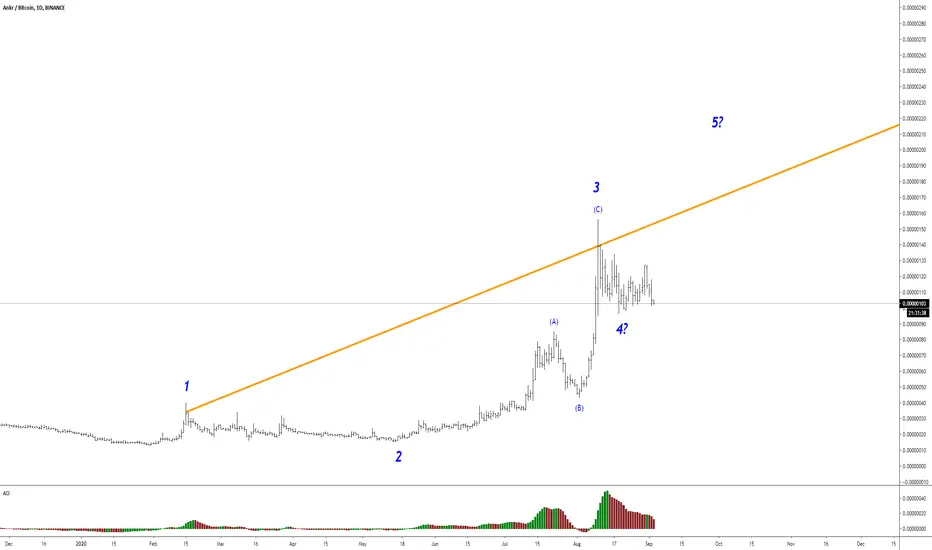
ANKR/BTC (Testing Swing Low Support)💎Technical Analysis Summary💎
BINANCE: ANKRBTC
-ANKR now touches the swing low support last August 2
-This is where the strong before it happened
-Currently, the 200D dynamic support is coinciding at this region
-If this area will maintain for the next 5-7 days
-And Try to form any reversal pattern like Double bottom
-RSI divergence is also a good reversal signal
-Please be patient to look for signs of strength
-Have a plan and calculate the amount willing to risk
``````````````````````````````````````````````
Trading Involves High Risk
Not Financial Advice
Please Exercise Risk Management
``````````````````````````````````````````````
If You Like My Daily Published Ideas
A little Help By Supporting My Channel
Through Leaving A Thumbs Up, Comment & Follow
Happy Trading! --> Thank You! :)
``````````````````````````````````````````````


Back to Ankr for all inI sold all my UNI coin at $8.50, now I'm coming back to Ankr which has a great opportunity


ANKR again58 sats support tested and not broken.
From here, upward movement will begin.
200 million coins will be burned this week (Spartan protocol)
When the burning process is completed, this will reflect positively on the price.
TP1 - 70 sats
TP2 - 85 sats
TP3 - 98 sats
TP4 - 105 sats
TP5 - 130 sats

ANKR is Continuation Bullish SWING TRADING STRATEGY
ANKR/BTC is getting ready to bullish again because the pair was breakout.
The support are EMA 21 and trendline(red line)
Entry : 106 - 124
Target 1 : 155
Target 2 : 185
Stop Loss : 99


ANKRBTC - Long - Potential 15.45%ANKRBTC - Long - Potential 15.45%
Entry - 110
TP1- 119
TP2 - 127
SL- 102
Please comment with thoughts and how you get on.
If you like the idea, then hit like on the idea & support with a follow.
Good luck out there!


ANKR / Bitcoin | Fractals!ANKRBTC seems to be forming the previous pattern in the ascending channel with perfect similarity..
- Posting to prove my point
Thank you


ANKR / BTC To me the whole market looks toped out. Most altcoins had a top and now trending down. Many charts look the same and most of them making lower highs and lower lows. Thats a down trend to me and nothing to be bullish about at all.
Volume are the fuel to drive the market/price higher. And now the volume is low and i not expect anything dramatic to happen. BTC controls it all so my advice are to keep an eye on BTC before buying alts at this moment. BTC dominance might be to help to look what direction the altcoins are trending.
I made a ANKR chart just now and it starts to look nice. But i want to see a daily close above 116 sats before i buy this one.
This are just my opinion right now please do you'r own research ,)

ANKR breakout?If you like my TA or other ideas, please leave a like to show support. It helps me out a lot
-------------------------------------------------------------------
- Descending triangle
- Low volume inside triangle
- Wait for the daily close
- 2X potential

ANKR is trying to beat the downtrendIt created new support which I showed with green. I expect it to see the upper channel resistance first (which is around 114)
If it breaks it with good momentum ( also with the support of the BTC) It will reach 134 and 156 respectively to form a cup.
So here are my targets:
TP1:114
TP2:134
TP3:156


