APEUSDT LongTrying this swing long setup on APEusdt here.
Entering a long position under 0.6050
Currently the price is holding key area and if this holds a bit more it can squeeze fast to upside.
A nice RR if happens.
Risky trade but can be worth it to take.
Invalidation clean break below 0.5900.
Note:Not a

APECOIN (APE) – Technical Outlook & Key Market InsightsDescription :
ApeCoin (APE) is the governance token of the Ape ecosystem, designed to support community-led initiatives within the Bored Ape Yacht Club (BAYC) and related projects. Its utility extends to governance, payments, and ecosystem participation, making it one of the most discussed tokens i

APE Main trend. Channel. Wedge. Reversal zones 05 05 2025Logarithm. Time frame 1 week.
1️⃣ Decline from the maximum by -98% , which is acceptable for assets of such liquidity and capitalization, after that either a trend reversal (main), or a complete scam.
2️⃣X (twitter) of this crypto project has 473 thousand subscribers . This army will be sent to p

apeusdt position tradeWait for correction. And buy on this zone. This is my point of interest of buying accumulating

APEUSDT – 1D AnalysisHey traders! 👋
Looking at APEUSDT on the daily chart, we can see that the market has completed a clear 5-wave impulse to the downside. After that strong bearish move, the resistance line was broken, which gave us the first signs of a potential reversal.
From there, we formed a smaller 5-wave impul

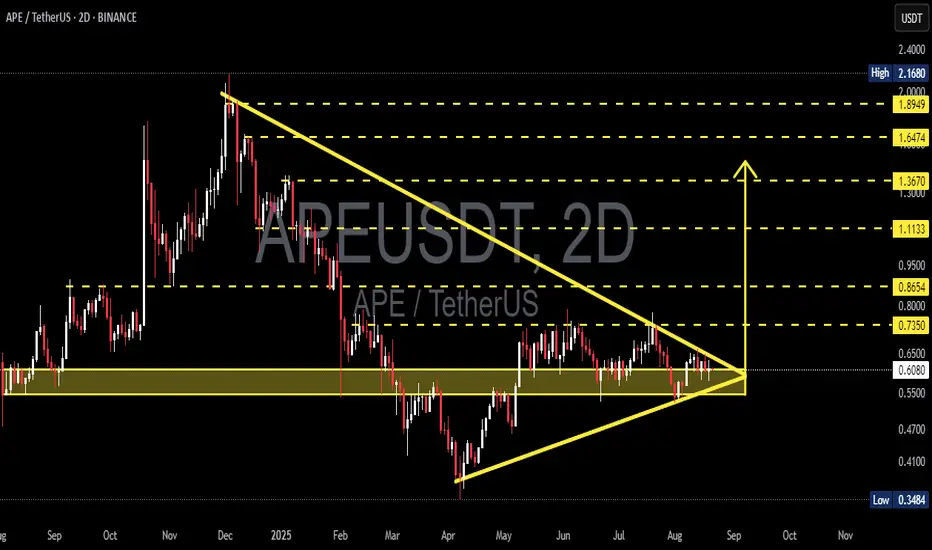
APE/USDT: Symmetrical Triangle – The Next Big Move is Loading!📊 Market Context:
APE/USDT is currently consolidating after a sharp move from the $2.168 high down to the $0.3484 low. The price action has now formed a symmetrical triangle, signaling compressed volatility and accumulation phase.
The $0.52 – $0.62 demand zone remains the critical support, while th
APEUSDTAPEUSDT shows strong bullish momentum on the 1-hour chart, supported by MACD and RSI trends. However, the KDJ and Bollinger Bands suggest the asset is nearing overbought conditions, which could lead to a short-term pullback or sideways movement. Traders should watch for confirmation signals before m

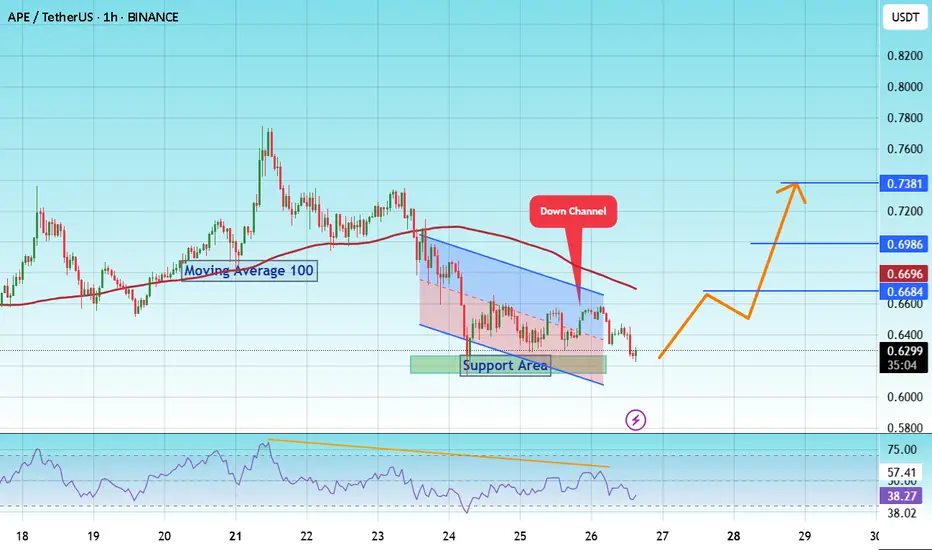
#APE/USDT Low Risk vs High Rewards#APE
The price is moving within a descending channel on the 1-hour frame and is expected to break and continue upward.
We have a trend to stabilize above the 100 moving average once again.
We have a downtrend on the RSI indicator that supports the upward break.
We have a support area at the lowe
Apecoin Technical Analysis · New All-Time High & Easy TargetsAs I told you just recently, the moving averages can be used in different ways. The main way is to gauge the market bearish or bullish potential and this is the classic way. The second one, less conventional, is to know how advanced is a trading pair within the current cycle.
Before everything was

ApeCoin Quick Update —Moving Next#APE
The price is moving within a descending channel on the 1-hour frame, adhering well to it, and is heading for a strong breakout and retest.
We have a bounce from the lower boundary of the descending channel, this support at 0.5827.
We have a bearish trend on the RSI indicator that is about to

See all ideas
Summarizing what the indicators are suggesting.
Oscillators
Neutral
SellBuy
Strong sellStrong buy
Strong sellSellNeutralBuyStrong buy
Oscillators
Neutral
SellBuy
Strong sellStrong buy
Strong sellSellNeutralBuyStrong buy
Summary
Neutral
SellBuy
Strong sellStrong buy
Strong sellSellNeutralBuyStrong buy
Summary
Neutral
SellBuy
Strong sellStrong buy
Strong sellSellNeutralBuyStrong buy
Summary
Neutral
SellBuy
Strong sellStrong buy
Strong sellSellNeutralBuyStrong buy
Moving Averages
Neutral
SellBuy
Strong sellStrong buy
Strong sellSellNeutralBuyStrong buy
Moving Averages
Neutral
SellBuy
Strong sellStrong buy
Strong sellSellNeutralBuyStrong buy
Displays a symbol's price movements over previous years to identify recurring trends.