APEX Main trend. DEX exchange Bybit. Hype and super pump 05 2025Logarithm. Time frame 1 week. Correction (descending channel, two distribution zones) after a super pump of about 1500%. All key support and resistance zones were shown, including dynamic ones.
Also showed a local target in percentage in case of exit from a local descending wedge. There is a possi

Apex long to $2.3932Just hopped into this apex long. Aiming for 2.3932 area
Sl: 1.9103
time sensitive likely to pump now or soon
4RR + trade

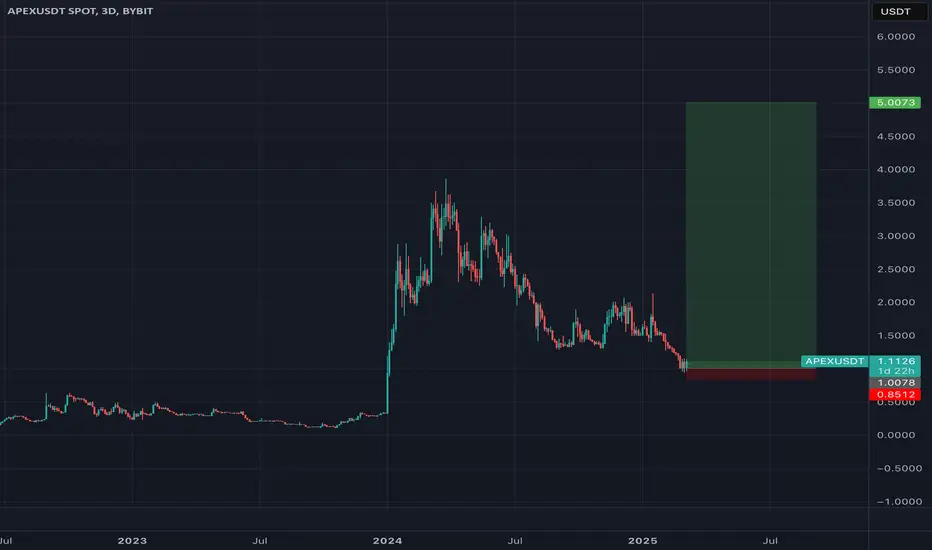
APEX – Ready to Pump? Target – $5!📈 APEX – Ready to Pump? Target – $5! 🚀
APEX looks like a hidden gem among altcoins! With a market cap of just GETTEX:62M , this token has massive upside potential, aiming for $5 and beyond.
🔥 Why Could APEX Skyrocket?
1️⃣ The Shift Towards DEX Platforms – As CEX regulations tighten, traders are
$APEX / $BTCThe NSE:APEX chart against CRYPTOCAP:BTC may indicate an upward movement for this currency in the near future. It is important to note that this is only a chart-based analysis and no news or fundamental analysis or other factors have been considered in this analysis. Therefore, it may contain er

$BYBIT:APEXUSDT
About ApeX ApeX Protocol is a decentralized, non-custodial, permissionless, censorship-resistant perpetual derivatives protocol that enables the introduction of perpetual swap markets for any token pairs. The protocol allows users to relegate crypto derivatives on the Ethereum blockchain with no in

Apex got some attentions hello there
in this chart I usesed bitcoin halving effect in weekly time frame that shown us strong bullish movement area that you see in green area
it takes abbout a year to see what will happen in this green area but it worth it to analyis
it happend every 4 year after halving and I called it

ARPA/USDT is on the verge of a big breakout! 🚀 ARPA/USDT is on the verge of a big breakout! 🚀
The ARPA/USDT trading pair is showing strong signs of a potential breakout as it approaches a key resistance level. 📈 If the price can push above this crucial zone, it could ignite a significant bullish rally, driving prices higher. Here’s a detailed

APEX - PUMP +50%?I found a coin that had been sold off for a long time. Now, what caught my attention is the local trend — accumulation near the resistance level, and also a descending wedge, which I haven't seen in a while. For me, this is a long-term position, possibly for 2-3 weeks or more, but I would lock in 50

#APEX Sailing the Crypto Seas: A Strong Buy Signal Beckons!**Technical Analysis Chart Description:**
Welcome to my Technical Analysis charts on TradingView! Before we dive into the analysis, it's essential to understand some important warnings:
1. **Subjectivity Alert:** Technical analysis involves interpreting market data and chart patterns, which can be

APEX Huge news! Pay attention to this powerhouse project!Pay attention to this powerhouse project! Our community started investing when the price was as low as 60 cents. We've got plenty of insider information about burning a portion of the supply and extending investor lockups for a year! That means the project will have an extremely low market capitaliz

See all ideas
Summarizing what the indicators are suggesting.
Oscillators
Neutral
SellBuy
Strong sellStrong buy
Strong sellSellNeutralBuyStrong buy
Oscillators
Neutral
SellBuy
Strong sellStrong buy
Strong sellSellNeutralBuyStrong buy
Summary
Neutral
SellBuy
Strong sellStrong buy
Strong sellSellNeutralBuyStrong buy
Summary
Neutral
SellBuy
Strong sellStrong buy
Strong sellSellNeutralBuyStrong buy
Summary
Neutral
SellBuy
Strong sellStrong buy
Strong sellSellNeutralBuyStrong buy
Moving Averages
Neutral
SellBuy
Strong sellStrong buy
Strong sellSellNeutralBuyStrong buy
Moving Averages
Neutral
SellBuy
Strong sellStrong buy
Strong sellSellNeutralBuyStrong buy
Displays a symbol's price movements over previous years to identify recurring trends.