APT is Bearish (4H)It has a bearish structure. We have an iCH (liquidity grab / mitigation) on the chart, the overall power is bearish, and price is trading below a resistance line. Recently, a base has also broken to the downside, and all signs indicate a bearish outlook.
We can enter a sell/short position once the
Related pairs

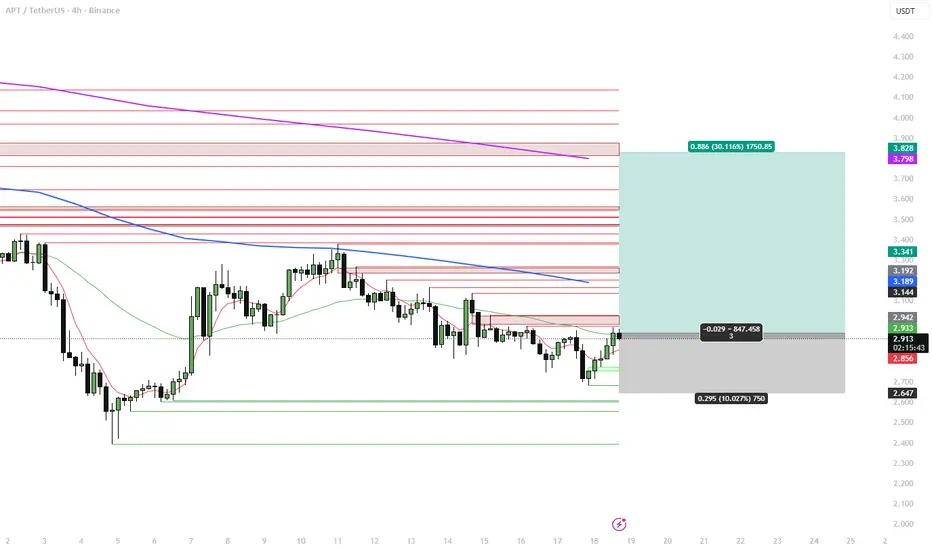
APT 4H – Stablecoin-heavy L1, swing long from local baseAptos is trading around $2.9 with a market cap near $2.1B, still down ~85% from the $19.9 ATH. At the same time the chain carries ~$512M TVL and ~$1.27B in stablecoins (almost half of that in the RWA token BUIDL). That’s a lot of liquidity for a token this depressed.
Over the last month APT is up ~
APT;Is it possible to climb the stairs?Hello friends
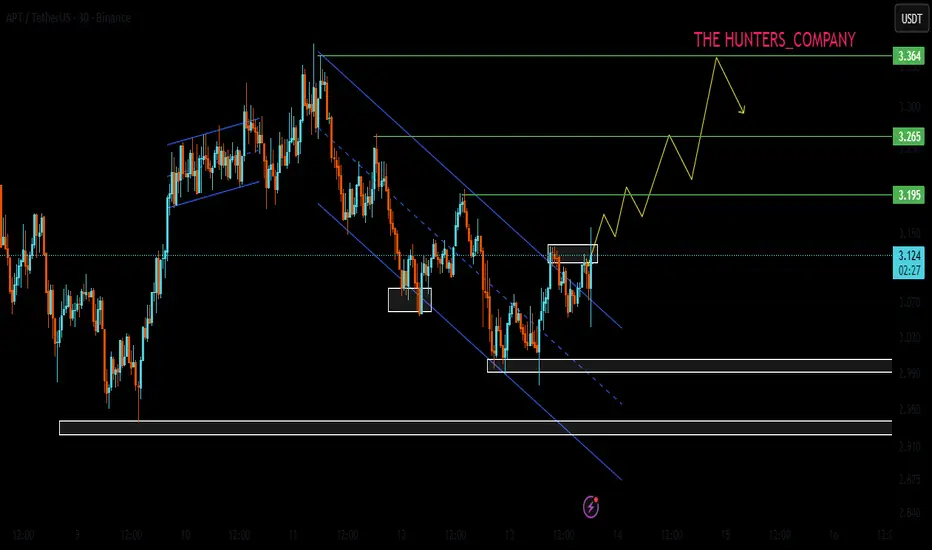
Considering the rise we had and the subsequent price compression that occurred, there is now an important resistance in the way of the price, and buyers can take the price to the higher targets that have been identified by breaking this resistance.
In case of further correction, we h
#APT/USDT 1H – Stablecoin-heavy, swing long from local base#APT
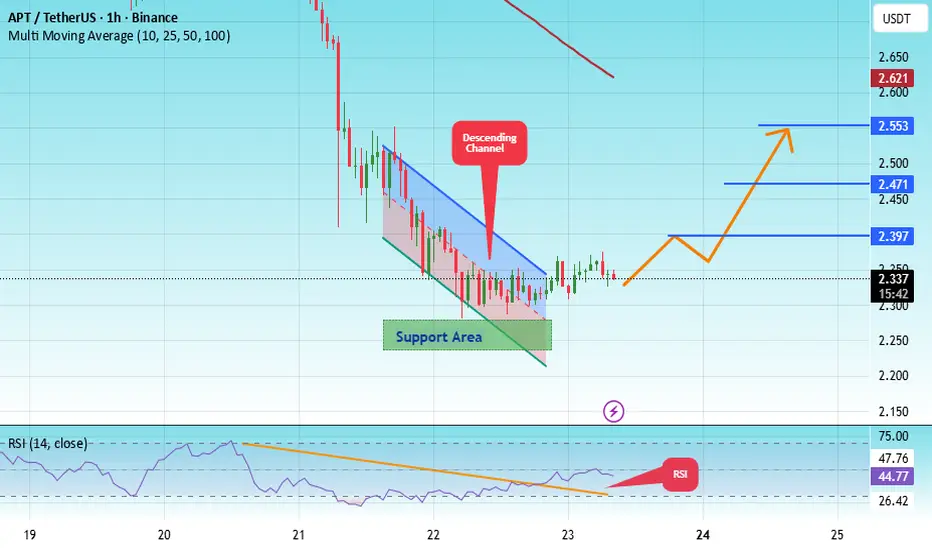
The price is moving within an ascending channel on the 1-hour timeframe and is adhering to it well. It is poised to break out strongly and retest the channel.
We have a downtrend line on the RSI indicator that is about to break and retest, which supports the upward move.
There is a key suppo
APT/USDT short term APT/USDT
Entry : under $3.3
Target : $4.0
Accumulate under $3.3
Fundamentally strong coin
👇👇👇👇
Aptos Partners with India’s Largest Telecom Jio to Launch Blockchain Rewards for 500M Users
Long term target $9 ++

#APT/USDT#APT
The price is moving within an ascending channel on the 1-hour timeframe and is adhering to it well. It is poised to break out strongly and retest the channel.
We have a downtrend line on the RSI indicator that is about to break and retest, which supports the upward move.
There is a key suppo

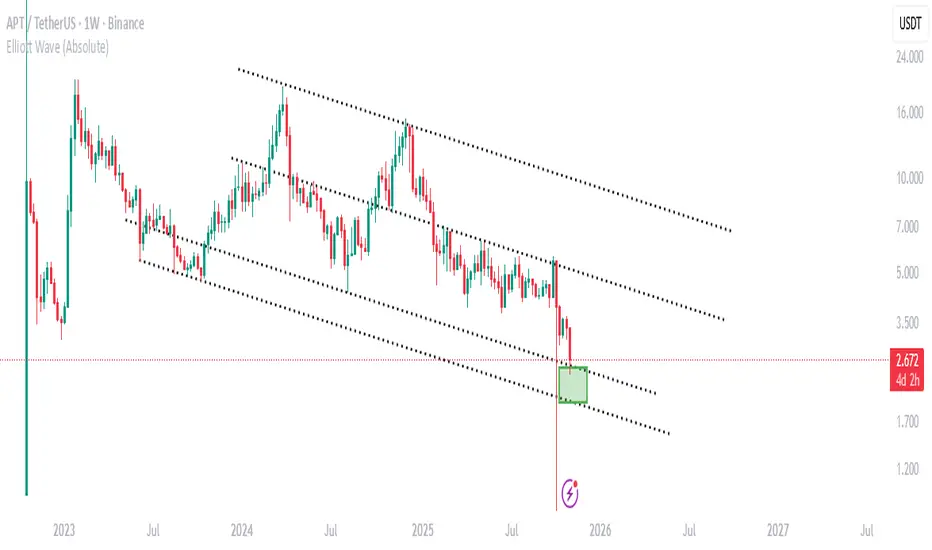
APTOS engaging in a battle of a lifetimeAPT has entered a dip-discovery phase, venturing into price territory with no prior historical action. These levels often present asymmetric opportunities — high potential reward, but elevated risk. The objective here is to locate an entry where downside exposure is limited while maximizing upside p
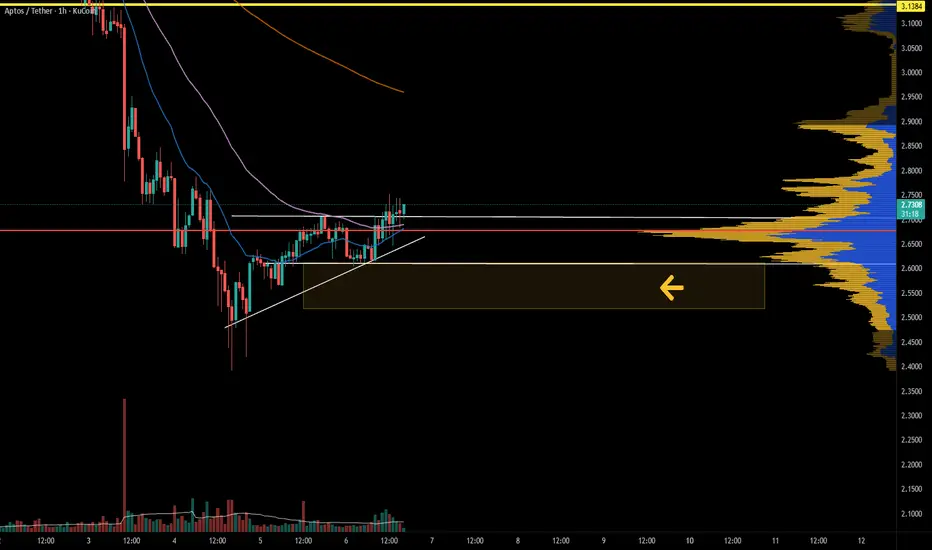
support and resistance in algousdt in aptusdtyou can see the suppert and resistance level on the chart
APT USDT LONG SIGNAL---
⚠️ Disclaimer:
This analysis reflects personal market observation and is not financial advice.
Always perform your own chart review and apply strict risk management before entering any position.
📢 Signal Alert
🔹 Pair: APT / USDT
📈 Trade Type: Long
💰 Entry Price: 2.6576
🎯 Take-Profit Targets:

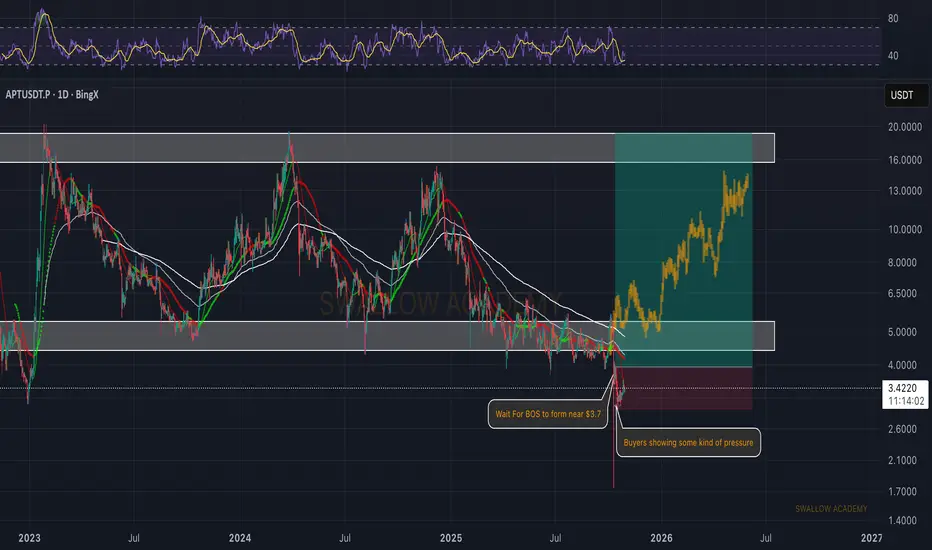
Aptos (APT): Looking For Break of Structure Near $3.7APT buyers are starting to show some pressure again, but we’re still waiting for a proper BOS to form around the $3.7 area. That would be the first real sign that buyers are taking back control.
Once that happens, we could easily see a strong push toward the mid-range zone, and from there, continu
See all ideas
Summarizing what the indicators are suggesting.
Oscillators
Neutral
SellBuy
Strong sellStrong buy
Strong sellSellNeutralBuyStrong buy
Oscillators
Neutral
SellBuy
Strong sellStrong buy
Strong sellSellNeutralBuyStrong buy
Summary
Neutral
SellBuy
Strong sellStrong buy
Strong sellSellNeutralBuyStrong buy
Summary
Neutral
SellBuy
Strong sellStrong buy
Strong sellSellNeutralBuyStrong buy
Summary
Neutral
SellBuy
Strong sellStrong buy
Strong sellSellNeutralBuyStrong buy
Moving Averages
Neutral
SellBuy
Strong sellStrong buy
Strong sellSellNeutralBuyStrong buy
Moving Averages
Neutral
SellBuy
Strong sellStrong buy
Strong sellSellNeutralBuyStrong buy
Displays a symbol's price movements over previous years to identify recurring trends.
Frequently Asked Questions
The current price of APT / UST (APT) is 2.24960000 USDT — it has fallen −4.57% in the past 24 hours. Try placing this info into the context by checking out what coins are also gaining and losing at the moment and seeing APT price chart.
APT / UST price has fallen by −17.17% over the last week, its month performance shows a −31.83% decrease, and as for the last year, APT / UST has decreased by −81.90%. See more dynamics on APT price chart.
Keep track of coins' changes with our Crypto Coins Heatmap.
Keep track of coins' changes with our Crypto Coins Heatmap.
APT / UST (APT) reached its highest price on Jan 30, 2023 — it amounted to 20.35900000 USDT. Find more insights on the APT price chart.
See the list of crypto gainers and choose what best fits your strategy.
See the list of crypto gainers and choose what best fits your strategy.
APT / UST (APT) reached the lowest price of 1.83530000 USDT on Oct 10, 2025. View more APT / UST dynamics on the price chart.
See the list of crypto losers to find unexpected opportunities.
See the list of crypto losers to find unexpected opportunities.
The safest choice when buying APT is to go to a well-known crypto exchange. Some of the popular names are Binance, Coinbase, Kraken. But you'll have to find a reliable broker and create an account first. You can trade APT right from TradingView charts — just choose a broker and connect to your account.
Crypto markets are famous for their volatility, so one should study all the available stats before adding crypto assets to their portfolio. Very often it's technical analysis that comes in handy. We prepared technical ratings for APT / UST (APT): today its technical analysis shows the sell signal, and according to the 1 week rating APT shows the strong sell signal. And you'd better dig deeper and study 1 month rating too — it's strong sell. Find inspiration in APT / UST trading ideas and keep track of what's moving crypto markets with our crypto news feed.
APT / UST (APT) is just as reliable as any other crypto asset — this corner of the world market is highly volatile. Today, for instance, APT / UST is estimated as 7.06% volatile. The only thing it means is that you must prepare and examine all available information before making a decision. And if you're not sure about APT / UST, you can find more inspiration in our curated watchlists.
You can discuss APT / UST (APT) with other users in our public chats, Minds or in the comments to Ideas.