Arbitrum (ARB): Expecting Bullish Movement Above EMAs | Step 2ARB has been moving in 3-step phases. Currently we are again in Step 1, where the next phase should be the movement back above the EMAs.
The current support might be the level price bounces from, but it is not confirmed yet. What we are sure about is that a bounce should happen anytime soon… if pri
Related pairs

ARB - JUMP SHIP or BAGHOLD ??Hello Traders
ARB is at an all time low.
Since October last year, it's basically been a freefall or call it price discovery if you will, but to the down side. The true question here is if buyers will still show up for support, or if bag holders are just waiting for every opportunity to get out?

#ARB/USDT | Testing Wedge Breakout Amid Key Support#ARB
The price is moving within a descending channel on the hourly timeframe. It has reached the lower boundary and is heading towards a breakout, with a retest of the upper boundary expected.
The Relative Strength Index (RSI) is showing a downward trend, approaching the lower boundary, and an upw

Arbitrum continued dump to $0.0943Just opened a new short on AMEX:ARB
🛑Sl: $0.1122
🎯Tp: $0.0943
💰3.45RR
Based on my DTT analysis market is likely to continue lower today towards target area.
#arbitrum

#ARB/USDT | Testing Wedge Breakout Amid Key Support#ARB
The price is moving within a descending channel on the hourly timeframe. It has reached the upper boundary and is heading towards breaking it. A retest of this boundary is expected.
The Relative Strength Index (RSI) is showing an upward trend, as it has approached the upper boundary. A bearis

ARB: is the bounce finally here? key levels to watch todayARB. Tired of watching this thing bleed and asking if the bounce is finally real? After a brutal selloff, headlines around layer‑2 activity and renewed interest in scaling stories are slowly coming back, and the market stopped panic‑dumping this one. Today we see ARB stabilizing while the rest of th

Arbitrum long back to $0.1326Took a new long on AMEX:ARB
🛑sl: $0.1150
🎯Tp: $0.1287 area
💰+2RR if full tp gets hit
Aiming for a higher retest of daily level area around tp price.
#arbitrum

Arbitrum scalp longJust recently opened a scalp on arb.
Sl; $0.1177
Tp: $0.1217
Monitoring from 0.1204 for exit. But have the potential to spike right through towards tp.
DTT analysis applied.

ARB Continue dump to $0.105 todayJust now I opened a new short on $arb. Expecting continue dump towards October prior monthly wick low
🛑sl: $0.1298
🎯tp: $0.1050
💰3RR
A+ DTT setup
#arbitrum

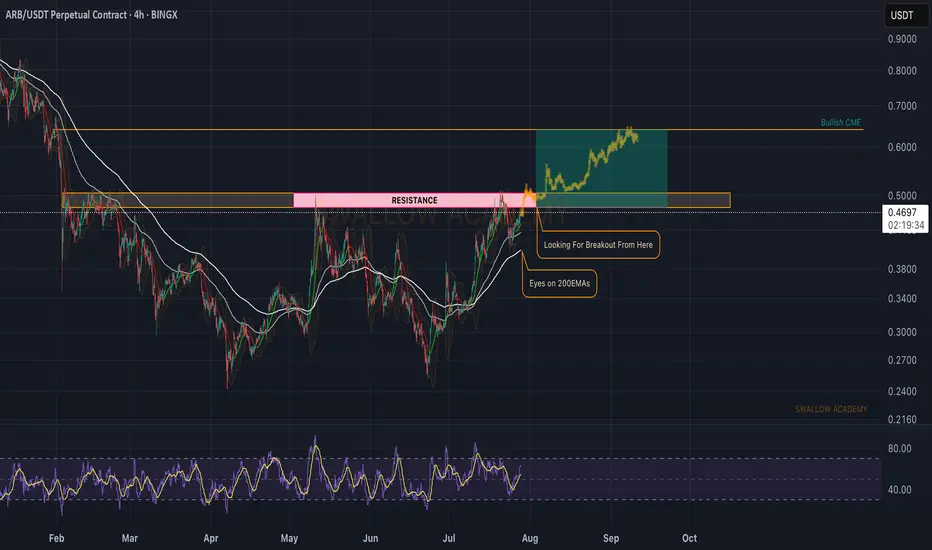
Arbitrum (ARB): Approaching Major Resistance ZoneARB is getting closer and closer to that resistance zone, which we are looking to be broken in order to give us that proper BOS and opportunity for movement to fill that bullish CME gap!
Swallow Academy
See all ideas
Summarizing what the indicators are suggesting.
Oscillators
Neutral
SellBuy
Strong sellStrong buy
Strong sellSellNeutralBuyStrong buy
Oscillators
Neutral
SellBuy
Strong sellStrong buy
Strong sellSellNeutralBuyStrong buy
Summary
Neutral
SellBuy
Strong sellStrong buy
Strong sellSellNeutralBuyStrong buy
Summary
Neutral
SellBuy
Strong sellStrong buy
Strong sellSellNeutralBuyStrong buy
Summary
Neutral
SellBuy
Strong sellStrong buy
Strong sellSellNeutralBuyStrong buy
Moving Averages
Neutral
SellBuy
Strong sellStrong buy
Strong sellSellNeutralBuyStrong buy
Moving Averages
Neutral
SellBuy
Strong sellStrong buy
Strong sellSellNeutralBuyStrong buy
Displays a symbol's price movements over previous years to identify recurring trends.
Frequently Asked Questions
The current price of ARB / TetherUS (ARB) is 0.1152 USDT — it has fallen −0.70% in the past 24 hours. Try placing this info into the context by checking out what coins are also gaining and losing at the moment and seeing ARB price chart.
ARB / TetherUS price has fallen by −2.15% over the last week, its month performance shows a −45.71% decrease, and as for the last year, ARB / TetherUS has decreased by −75.84%. See more dynamics on ARB price chart.
Keep track of coins' changes with our Crypto Coins Heatmap.
Keep track of coins' changes with our Crypto Coins Heatmap.
ARB / TetherUS (ARB) reached its highest price on Jan 11, 2024 — it amounted to 2.4250 USDT. Find more insights on the ARB price chart.
See the list of crypto gainers and choose what best fits your strategy.
See the list of crypto gainers and choose what best fits your strategy.
ARB / TetherUS (ARB) reached the lowest price of 0.0944 USDT on Feb 6, 2026. View more ARB / TetherUS dynamics on the price chart.
See the list of crypto losers to find unexpected opportunities.
See the list of crypto losers to find unexpected opportunities.
The safest choice when buying ARB is to go to a well-known crypto exchange. Some of the popular names are Binance, Coinbase, Kraken. But you'll have to find a reliable broker and create an account first. You can trade ARB right from TradingView charts — just choose a broker and connect to your account.
Crypto markets are famous for their volatility, so one should study all the available stats before adding crypto assets to their portfolio. Very often it's technical analysis that comes in handy. We prepared technical ratings for ARB / TetherUS (ARB): today its technical analysis shows the sell signal, and according to the 1 week rating ARB shows the sell signal. And you'd better dig deeper and study 1 month rating too — it's sell. Find inspiration in ARB / TetherUS trading ideas and keep track of what's moving crypto markets with our crypto news feed.
ARB / TetherUS (ARB) is just as reliable as any other crypto asset — this corner of the world market is highly volatile. Today, for instance, ARB / TetherUS is estimated as 5.02% volatile. The only thing it means is that you must prepare and examine all available information before making a decision. And if you're not sure about ARB / TetherUS, you can find more inspiration in our curated watchlists.
You can discuss ARB / TetherUS (ARB) with other users in our public chats, Minds or in the comments to Ideas.