ARB/USDT have some nice zones to buy I want to share with you a few zones to buy Arbitrum in case the correction continues and bitcoin continues its downward movement.
These zones are where I expect to see buyer action.
These buy zones are most likely better suited for long term hodlers and those who have not yet gotten into the market and are waiting for some reasonable prices to buy.
First one is in range 1.05-1.15$.
Second one is 0.80-0.82$.
Trade ideas

#ARB Really good Spot Opportunity 😎#ARB Really good Spot Opportunity 😎
We are now on really important and strong support zone.
Plus we got bullish divergence

ARB. Searching for returns.ARB experiences a decline of more than 50% within 35 days - that's quite a lot. Taking into account the Fibonacci levels, you can see where the bounce may be. RSI in oversold zone.

ARBUSDT Elliott wave countEnding diagonal wave ((c)) of 2 is preferred status for this price action.
We are watching for evidences and clearing wave (4) 1.5915 will increase the chance to turn the price up.
Price reached at a key support level, 0.618 fib retracement of wave 1.
Also a possible oscillators indicators divergence at this level.

ARB UPDATE (6H)ARB appears to be forming a large diametric that has now entered wave D.
From the green range it is expected to support and start the bullish wave E.
We consider such a pattern and path for ARB.
Closing a daily candle below the invalidation level will violate the analysis
For risk management, please don't forget stop loss and capital management
When we reach the first target, save some profit and then change the stop to entry
Comment if you have any questions
Thank You

ARB 12/04/2024 ARB is filling the 3D and daily imbalances. 1.22/1.16 levels are important. I want to see a range here for the confirmation. This should work as a strong support level.

#ARB/USDT#ARB
The price is moving in a downward channel on a 1-day frame and we have a green support area at level 14
Now we have a nice breakout coming up
Our RSI indicator has a trend that is about to break to the upside
Entry price is 16.40
The first goal is 18.57
The second goal is 20.15
Third goal 21.78

ARBI expected BTC to retest ATH on next week, and then nice to have return ARB and others alts like AVAX to retest own high.

I'm bullish on ARBARBUSDT/30min
ARB has been trading in a bullish wave
It's seems complicated the bullish pattern
Good luck


ARBUSDT SHORT OUTLOOKHello Traders, this is outlook that i think might be work. All Entry, Stop Loss, and Take Profit its already showed up. All trade it is on yourself. DYOR.

You down with ARB? Yeah you know me!If you find this information inspiring/helpful, please consider a boost and follow! Any questions or comments, please leave a comment!
My views on arb.
Not financial advice, do your own research.

ARB - Potential BullflagAlthough, there is cause for concern based on TOTAL, some altcoins look like they have bottoming setups.
Here are some bullish signals forming in the chart. If we do end up breaking down we can fall between $1-1.10 where the VRVP sits. But for the time being the bullish pattern remain in tact:
- ARB looks to be forming a bullflag.
- Lower low support trendline (bottom yellow line).
- Liquidity test of 0.618.
- 1D 200 MA acting as support (purple MA).
- 1D RSI double bottom at oversold (green circles).

ARBUSDT longARBUSDT:
- diver+mbos + 2 swip of liq.
It can be deviation for flat or test flat bottom before going down. Will try small take, if it is a deviation it should give one more enter from flat like a mid-bottom test
Arbitrum IndecisivenessLots of indecisiveness surrounding ARB. This is one of those moments, as a trader, where you can't rush into a trade. You have to let the market decide and then make a move to go with the flow.
Symmetrical Triangle...Check
HL on PA (so far)... Check
LL RSI... Check!
Poking of 55MA...Check!
The close on the daily TF today will be key in forecasting what the PA will be tomorrow. If we close below the triangle, below the 55MA and re-test from below it in the next several days, I'll be looking to enter short with a TP @ $1.3 . Otherwise a re-test of the top isn't particularly attractive considering the RRR.
Cheers!

short ARBARB broke through the support level and the ascending trendline. A decline to the support level at $1.05 is expected to happen.

ARB - BIG wait for pattern before LONGARB - BIG wait for pattern before LONG
The price is in the middle of the range
I think within few day some pump can happen especially if the price break above 1st deviation and close there

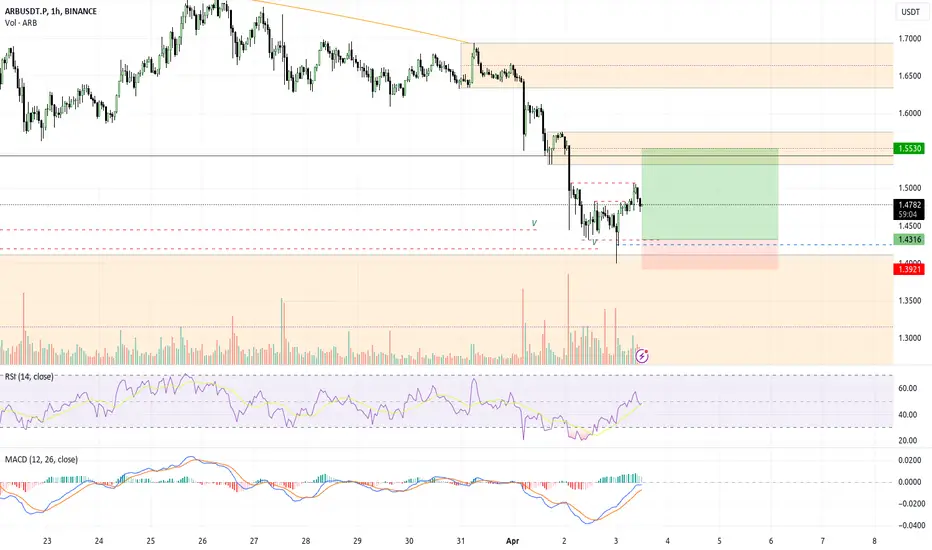
ARB: sell in channel📊Analysis by AhmadArz:
🔍Entry: 1.526
🛑Stop Loss: 1.577
🎯Take Profit: 1.477-1.424-1.353-1.280
🔗"Uncover new opportunities in the world of cryptocurrencies with AhmadArz.
💡Join us on TradingView and expand your investment knowledge with our five years of experience in financial markets."
🚀Please boost and💬 comment to share your thoughts with us!

ARBI think ARB deserves a special idea. Its clean range just got cleaner. I already have a spot bag but risking some more for a short-term trade looks fine to me. NFA :D

arb LOOKS READYarb went down so hard also the first one to get fukd
firstly token unlock
scnd btc down trend
but it held yestrday giving a ray of hope
and look at the daily candle it printed
same shit happened during 23 jan
it was in down trend going down as hard as it can
btc looked way oversold
i thought 59 was the bottom
maybe there will be a flash crash to fill 59k orders or not
but so far arb$ looks good
macd giving a reversal sign
just one more daily green candle closing above 1.74 and i will long this bastrd

ARB to 2.60 $ and more target hello this fractel for my friend ask me for chart arb coin i can see hum go to 10 $
just holding bro , and im hire for u , follow me to get more news
and write me if you need any coin chart
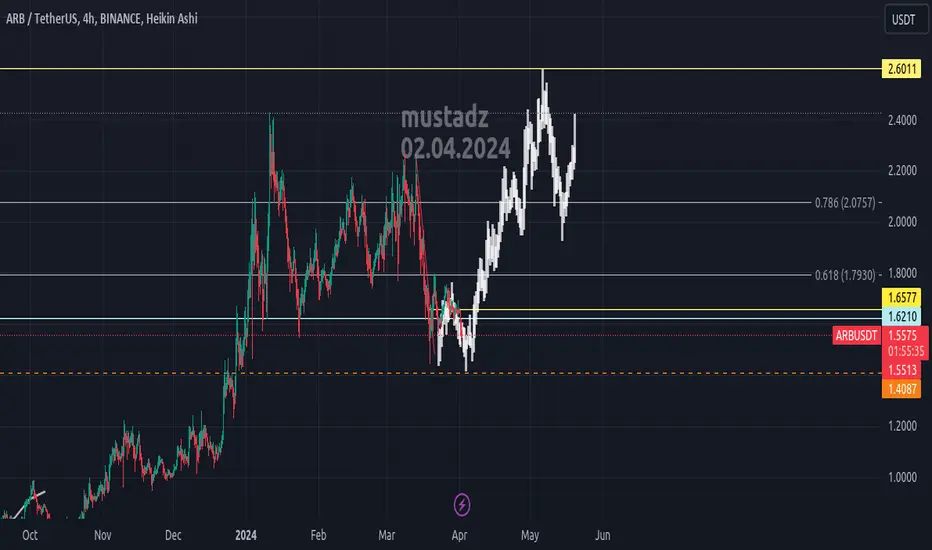
ARB/USDTLong term targets marked in the chart.
accumulate under $2
TP 1 : $3.3
TP 2 : $4.9
TP 3 : $6.19
TP 4 : $7.47

ARBUSDT ARBUSDT
good opportunity of buying arb is from the current level 1.6500
the we will sell this coin from 3.00
let's get profit from wave 5
