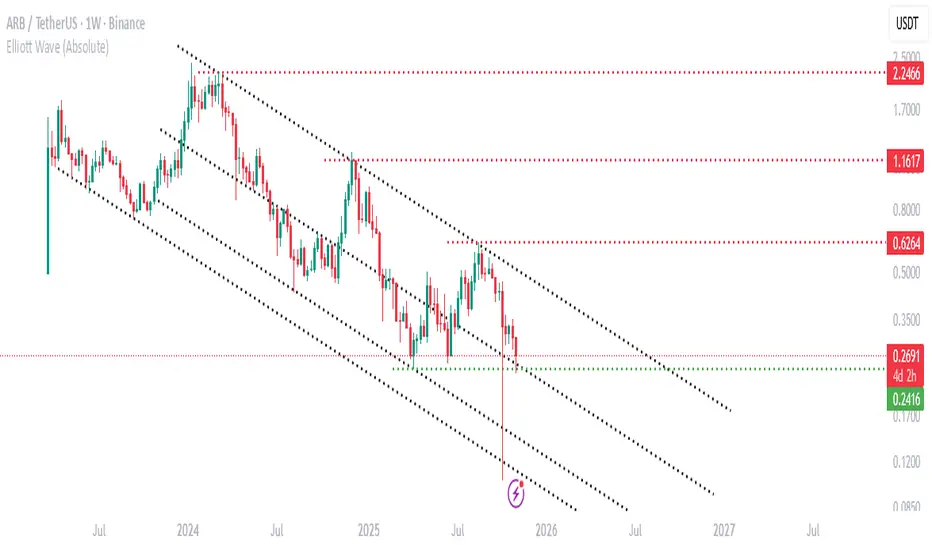
$ARB Risky but possible ScenarioRisky but possible Scenario based on 3-drive
Only if Arb doesn't lose the support
Trade ideas

ARB/USDT – The zone is interesting for starting accumulation.Arbitrum - is an Ethereum layer-two (L2) scaling solution. It uses optimistic rollups to achieve its goal of improving speed, scalability and cost-efficiency on Ethereum. Arbitrum benefits from the security and compatibility of Ethereum. Another benefit is the higher throughput and lower fees compared to Ethereum. That is made possible thanks to moving most of the computation and storage load off-chain.
Arbitrum’s native token is called ARB and is used for governance. Offchain Labs, the developers behind Arbitrum, announced the shift to a decentralized autonomous organization (DAO) structure — the Arbitrum DAO. ARB holders can vote on proposals that affect the features, protocol upgrades, funds allocation and election of a Security Council.
CoinMarketCap : #51
The hyped-up Arbitrum! 😂
📉 January - February - March 2024: Bloggers trapped a huge number of people, and now we’re seeing a massive -87% decline!
Looking at the main trend, a large descending channel is forming. The price is currently at the support of the inner channel, and if the market makes a final liquidity grab with a downward wick, the price could head toward the support of the outer channel, targeting a -30% drop.
In my previous trading idea, I marked the 1.1552 zone, which is exactly where the price reversed. Everything is marked on the chart—the potential profit is very solid, especially for spot trading. The price will react strongly to the resistance zones of both the inner and outer channels.
🚀 These are the moments to watch for position accumulation—when no one is interested and belief in growth is dead, not when everyone is screaming "BUY NOW!" at local tops!
*I will update the trading idea as the trend develops.

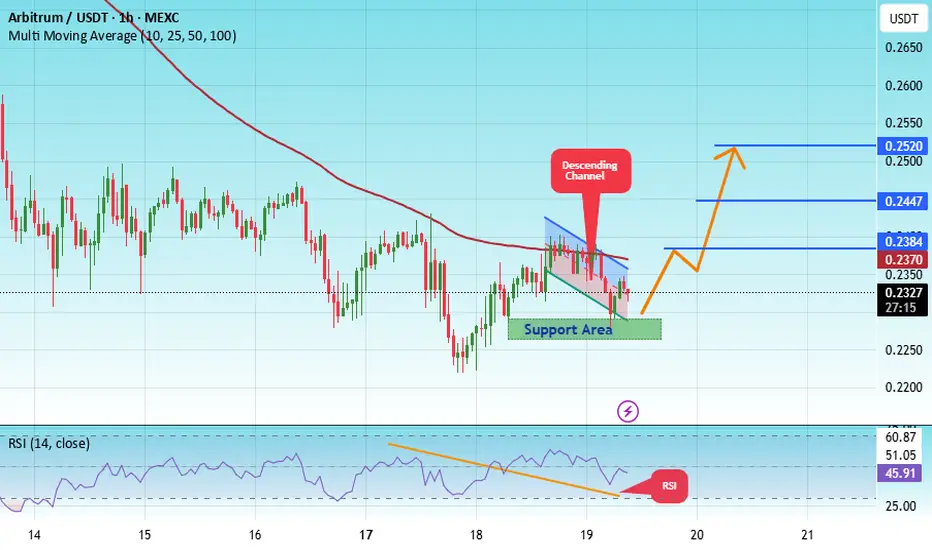
#ARB/USDT | Testing Wedge Breakout Amid Key Support#ARB
The price is moving within an ascending channel on the 1-hour timeframe and is adhering to it well. It is poised to break out strongly and retest the channel.
We have a downtrend line on the RSI indicator that is about to break and retest, which supports the upward move.
There is a key support zone in green at 0.2276, representing a strong support point.
We have a trend of consolidation above the 100-period moving average.
Entry price: 0.2318
First target: 0.2384
Second target: 0.2447
Third target: 0.2520
Don't forget a simple money management rule:
Place your stop-loss order below the green support zone.
Once you reach the first target, save some money and then change your stop-loss order to an entry order.
For any questions, please leave a comment.
Thank you.
Arbitrum (ARB): Another Bounce From Support | Bullish SetupARB continues to build strength right at a key support area that has acted as a turnover zone multiple times before. This rounded structure gives buyers a solid base to work from, and the probability of this push turning into a similar recovery move as in previous reactions is fairly high.
For now, we keep watching how price behaves near EMAs — a clean breakout and retest from this region could easily turn into a high R:R long setup toward the upper targets.
Swallow Academy

#ARB/USDT — Last Line of Defense: Reversal Incoming or Breakdo#ARB
The price is moving within an ascending channel on the 1-hour timeframe and is adhering to it well. It is poised to break out strongly and retest the channel.
We have a downtrend line on the RSI indicator that is about to break and retest, which supports the upward move.
There is a key support zone in green at 0.2517, representing a strong support point.
We have a trend of consolidation above the 100-period moving average.
Entry price: 0.2619
First target: 0.2693
Second target: 0.2776
Third target: 0.2883
Don't forget a simple money management rule:
Place your stop-loss order below the green support zone.
Once you reach the first target, save some money and then change your stop-loss order to an entry order.
For any questions, please leave a comment.
Thank you.

support and resistance in algousdt in ARBUSDTyou can see the suppert and resistance level on the chart
Monthly Crypto Analysis: Arbitrum (ARBUSD) – Issue 95 The analyst believes that the price of Arbitrum will decrease within the time specified on the countdown timer. This prediction is based on a quantitative analysis of the price trend.
___Please note that the specified take-profit level does not imply a prediction that the price will reach that point. In this framework of analysis and trading, unlike the stop-loss, which is mandatory, setting a take-profit level is optional. Whether the price reaches the take-profit level or not is of no significance, as the results are calculated based on the start and end times. The take-profit level merely indicates the potential maximum price fluctuation within that time frame.

#ARB/USDT#ARB
The price is moving within an ascending channel on the 1-hour frame, adhering well to it, and is heading for a strong breakout and retest.
We have a bearish trend on the RSI indicator that is about to be broken and retested, which supports the upward breakout.
There is a major support area in green at 0.3200, which represents a strong support point.
We are heading for stability above the 100 moving average.
Entry price: 0.3307
First target: 0.3363
Second target: 0.3470
Third target: 0.3618
Don't forget a simple matter: capital management.
When you reach the first target, save some money and then change your stop-loss order to an entry order.
For inquiries, please leave a comment.
Thank you.

Arbitrum (ARB): Expecting Proper Fill of Upper Zones | BullishARB had a strong bounce from the marked support, where buyers managed to shift the market structure after the recent selloff. That move gave us a decent MSB, and now price is heading toward the unfilled zones above — our current target area.
As long as buyers keep control over this bounce zone, continuation toward 0.42 remains in play.
Swallow Academy

ARB/USDT — Last Line of Defense: Reversal Incoming or Breakdown?ARB is now standing at a critical confluence zone between $0.305 and $0.270 — a major demand area that has repeatedly acted as the final support since early 2025.
The broader structure remains bearish under a descending resistance line, yet the price reaction near the lower boundary suggests the potential formation of a falling wedge, a classic reversal pattern.
The recent long lower wick shows a liquidity sweep — likely a stop-hunt phase where weak longs are shaken out before a potential trend reversal. If buyers manage to defend this zone, a powerful rebound could emerge.
---
Technical Structure & Pattern
Key Demand Zone (Yellow Block):
$0.305 – $0.270 → strong historical demand zone and current buyer defense line.
Descending Resistance Line:
Continues to suppress every bullish attempt since December 2024.
A confirmed breakout and close above it would mark the first structural shift toward bullish momentum.
Ascending Support Line:
Connects recent higher lows, forming a converging wedge structure — often a precursor to a breakout.
Main Resistance Levels:
$0.4809 → $0.5889 → $0.9187 → $1.1646 (progressive upside targets).
---
Bullish Scenario
Confirmation Signs:
Strong rejection and candle close above $0.305 with rising volume.
Breakout and close above the descending trendline resistance.
Upside Targets:
TP1: $0.4809
TP2: $0.5889
TP3: $0.9187 (extended target if momentum builds)
Market Narrative:
Buyers reclaim control from a deep accumulation zone, signaling the first real chance of a structural reversal. A successful breakout could trigger a mid-term recovery trend toward $0.50 and beyond.
---
Bearish Scenario
Confirmation Signs:
2D candle closes below $0.270 with strong follow-through selling pressure.
Failed rebound from the demand zone.
Downside Targets:
TP1: $0.220
TP2: $0.165 (historical capitulation zone)
Market Narrative:
If this demand zone breaks, sellers will likely dominate, pushing ARB into a deeper distribution phase. This would confirm the continuation of the broader bearish structure.
---
Conclusion: The Make-or-Break Zone
ARB is currently at a critical inflection point.
The $0.305–$0.270 zone is the last stronghold for bulls — a decisive rejection here could mark the beginning of a major reversal.
But if it fails, ARB could slide toward $0.22 or even $0.16, signaling a deeper leg down in the market cycle.
This is a make-or-break moment for ARB — the next move will define its medium-term trend direction.
---
#ARB #ARBUSDT #CryptoAnalysis #TechnicalAnalysis #FallingWedge #DemandZone #SupplyDemand #CryptoTrading #PriceAction #SwingTrade #MakeOrBreak #ReversalSetup #ChartAnalysis #CryptoMarket

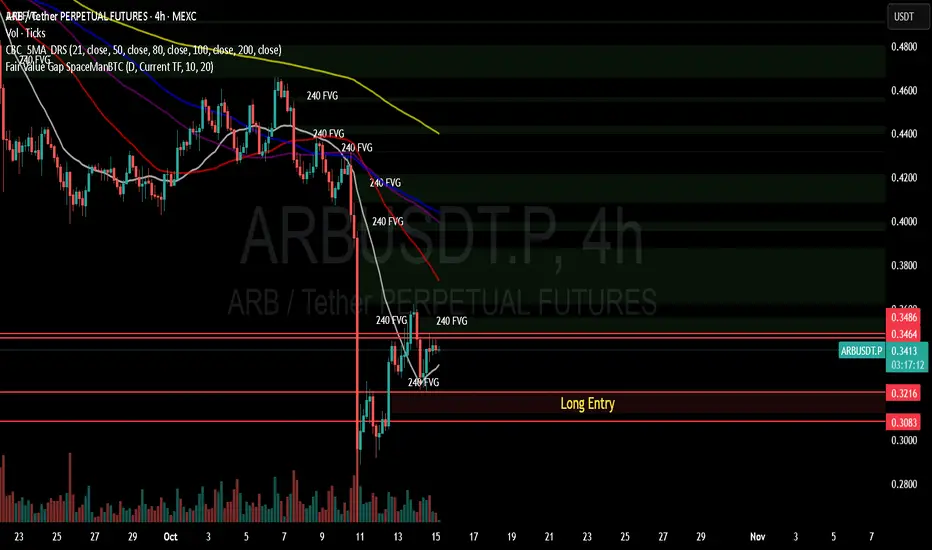
ARBUSDT Multi-Timeframe Analysis | FVGs Align for Major Move ARB is showing a rare alignment across all timeframes:
🔹 5m – 15m: Short-term structure consolidating right below a 0.348 liquidity shelf, with multiple small FVGs suggesting a coiled breakout zone.
🔹 30m – 1h: Mid-range compression between 0.334 – 0.348; price continues to defend the 200 EMA and is building higher-low structure.
🔹 1W (Weekly): A clean bullish FVG has formed—if price fills and reclaims this zone, it could unlock nearly 100 % upside potential from current levels.
🔹 1M (Monthly): Macro support sits around 0.32 – 0.34, marking the accumulation floor since early 2024.
Together, these setups hint that ARB may be preparing for a strong rotation phase once market liquidity returns.
📈 Key Levels:
Support → 0.334 / 0.321
Resistance → 0.348 / 0.36
Macro Target (Weekly FVG Top) → ≈ 0.60 region
💡 Observation: Watch how USDT Dominance behaves around 4.82 %. A rejection there could trigger ARB’s next leg up.
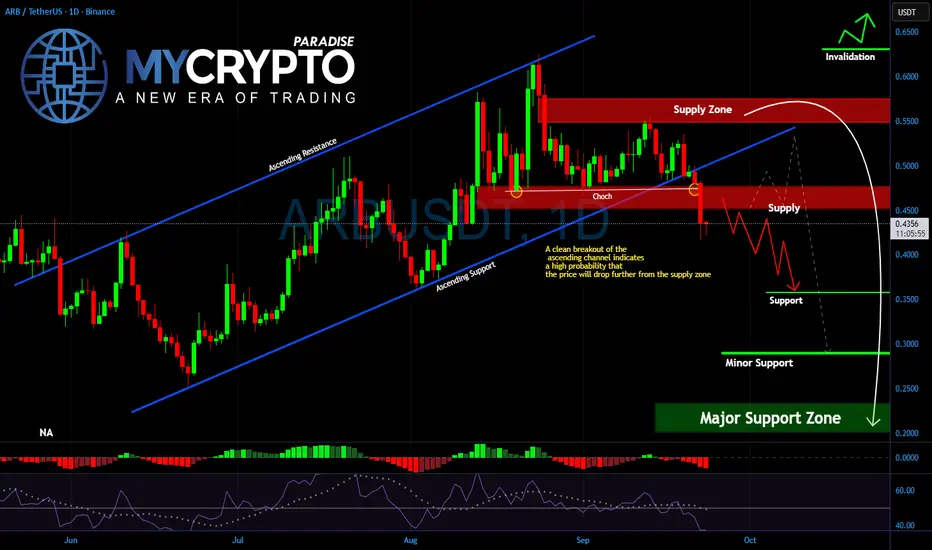
ARB Breaks Structure – Is the Drop to $0.30 Already in Motion?Yello Paradisers, what happens when a strong uptrend finally cracks under pressure? That’s exactly what we are seeing with #ARBUSDT right now. The ascending channel that carried price action since June has officially been broken, and history tells us this is rarely a small signal. A clean breakdown from such a channel often marks the beginning of a deeper move, and #ARB is showing all the signs that more downside could unfold.
💎After failing to hold inside the channel, #ARB retested the broken zone but quickly rejected from supply around $0.45–$0.50. This rejection zone is now the key barrier standing above price. As long as #ARBITRUM trades below it, sellers are in control, and the probability of further decline remains high.
💎The next important area to watch lies at $0.35, which acts as the first strong support. If that level gives way, the move could accelerate toward the $0.30 minor support before potentially reaching the major support zone around $0.20–$0.25. This entire area is where bigger buyers could look to step in, but until then, the path of least resistance is clearly to the downside.
💎Invalidation for this bearish outlook would only come if AMEX:ARB reclaims the $0.55 supply zone and holds above it. Until then, traders must respect the bearish momentum.
🎖Strive for consistency, not quick profits. These breakdowns are where inexperienced traders get wiped out, while disciplined ones wait patiently for the best opportunities.
MyCryptoParadise
iFeel the success🌴
ArbChart Structure:
Price action is forming a rising wedge/triangle, approaching the upper trendline (likely near 0.36–0.37).
wait for price to touch the upper boundary—this is where late longs panic in, crowding the top, and a sweep or rejection at the trendline offers a prime short entry.
short
entry 36-38
tp
0.35
0.347
0.34
0.33
stoploss
0.44

Altcoin Scam WickWe had an absolute melt down in the crypto markets, classic manipulation by the market makers. If you were lucky enough, you could have longed Atom at $0.01 and be up over 340,000%.
I was not that lucky, but managed to catch a trade on Arbitrum. If you follow my trades, you will know that I had my technicals on this chart already. We had a collapse to new lows, but technical support bounce. I took a long trade at $0.11 with some limit orders filled during the flash crash.
I suspect we get a blast off in alts from here, a strong liquidity sweep was taken. Now I will remain patient in my long here, stop loss has been moved up - I am already up 212% on this trade.
Not financial advice, do what's best for you

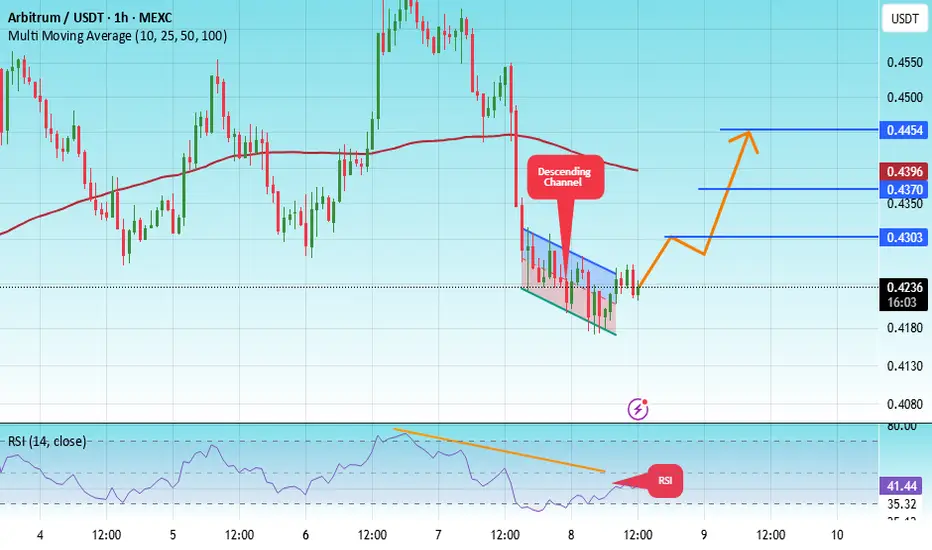
#ARB/USDT Analysis: Breakout Potential with Overbought RSI !#ARB
The price is moving within a descending channel on the 1-hour frame, adhering well to it, and is heading for a strong breakout and retest.
We have a bearish trend on the RSI indicator that is about to be broken and retested, which supports the upward breakout.
There is a major support area in green at 0.4180, which represents a strong support point.
We are heading for consolidation above the 100 moving average.
Entry price: 0.4229
First target: 0.4303
Second target: 0.4370
Third target: 0.4454
Don't forget a simple matter: capital management.
When you reach the first target, save some money and then change your stop-loss order to an entry order.
For inquiries, please leave a comment.
Thank you.
Relief Rally or Further Drop? Key Levels to Watch on ARBUSDTARBUSDT continues its descent after invalidating the macro rising wedge, with price action firmly suppressed below key supply zones. Current wave structure hints at a potential relief rally toward 0.3886 before resuming the broader bearish trajectory toward the projected drop target at 0.1718. Until the macro descending trendline at 0.6259 is decisively broken, bearish sentiment remains dominant.

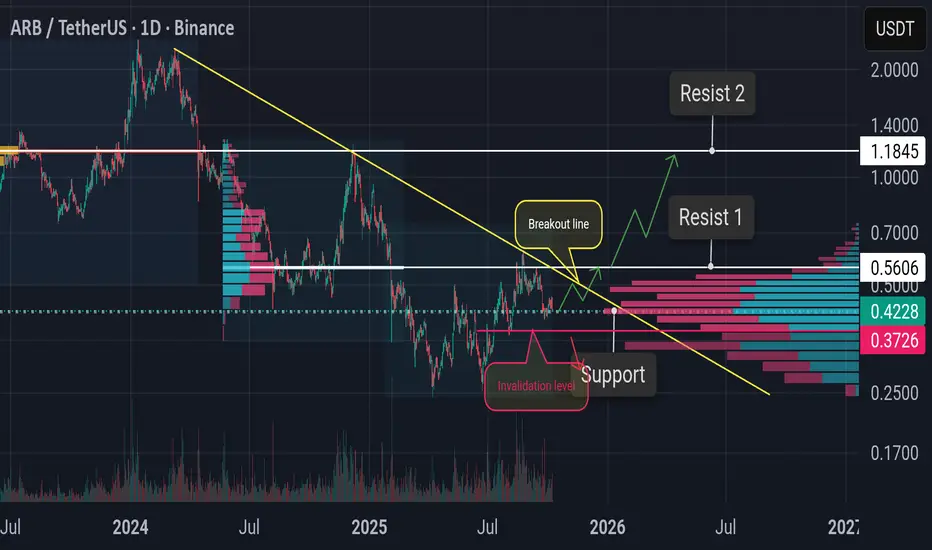
ARB Rebound Alert !!!🔥 ARB is showing a strong bounce from the key support at 0.4235 — this level is crucial for a potential rebound toward Resistance 1 at 0.5606 💪
⚡ The yellow line = breakout line, needs to be broken to confirm a reversal into a bull trend 🚀
Once it breaks out, the path toward Resistance 2 (1.1845) looks wide open 😎📈
❌ Invalidation: if price falls below 0.3726 (red line) — watch out for further downside 🩸
ARB USDTARB Analysis
You can buy in this small correction and make a good profit
No analysis is 100%

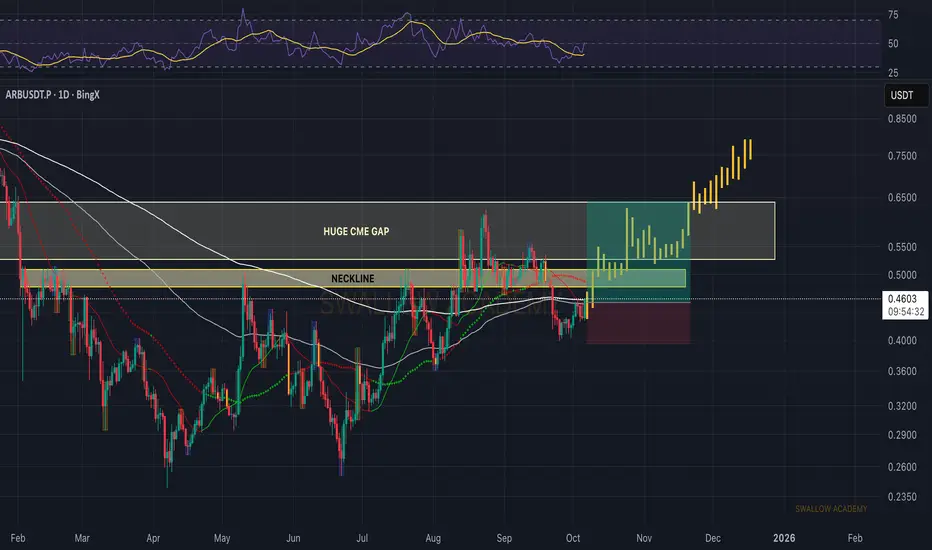
Arbitrum (ARB): Very Huge CME Gap | Magnet ZoneARB is showing early signs of reversal as buyers start regaining momentum near the neckline. Price has been consolidating tightly, and now the focus shifts to a possible breakout toward the upper zone.
The huge CME gap above remains unfilled and usually acts as a magnet — that’s the zone we’re targeting next. As long as this neckline is protected, we can expect continuation toward $0.70–$0.80 in the coming weeks.
Swallow Academy
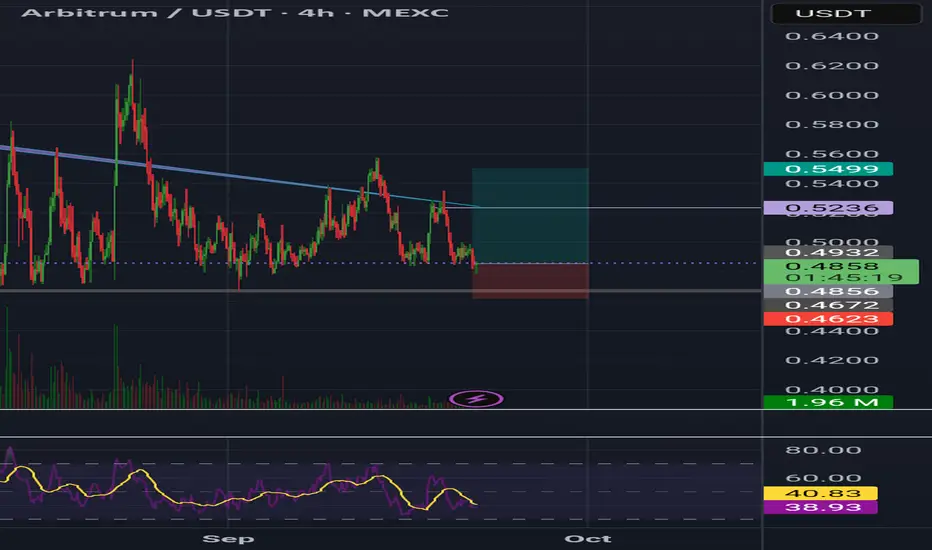
It's a time for ARBUSDT - POTENTIAL TARGET 0.50 $On the Arbitrum (ARB/USDT, 4h) chart, we can see that after a strong downtrend, the price found support around the $0.42 level, where a local bottom was formed. From that point, the market began a recovery, pushing the price up toward the $0.46–$0.47 zone before entering a corrective pullback.
Currently, the price is testing a key support area around $0.43–$0.44, which aligns with previous resistance and the 20- and 50-period EMAs. The RSI indicator has pulled back from overbought territory but remains above the 50 mark, indicating that buyers still have the upper hand in the medium term.
If the price holds above $0.43, there’s a strong possibility of a rebound toward the $0.48–$0.50 resistance zone — a key level that could act as the next target for bullish momentum. A breakout above $0.50 could further open the path toward $0.52.
Potential TP: 0.50 $
This analysis is for informational and educational purposes only and does not constitute financial advice or an investment recommendation.

#ARB/USDT (ARB): Looking For Buy Entry | 2 Zones To Keep an Ey#ARB
The price is moving within a descending channel on the 1-hour frame, adhering well to it, and heading for a strong breakout and retest.
We have a bearish trend on the RSI indicator that is about to be broken and retested, which supports the upward breakout.
There is a major support area in green at 0.4140, which represents a strong support point.
We are heading for consolidation above the 100 moving average.
Entry price: 0.4160
First target: 0.4215
Second target: 0.4264
Third target: 0.4325
Don't forget a simple matter: capital management.
When you reach the first target, save some money and then change your stop-loss order to an entry order.
For inquiries, please leave a comment.
Thank you.

ARBUSDT D1 Bullish ScenarioIn the ARB price chart, the price is in a daily demand range and we are witnessing a positive hidden divergence in the MACD. We can expect a growth of at least 20% for this currency.
