ASRUSDT 1D#ASR has bounced off the support zone and the SMA200 on the daily chart. The chart looks promising. If the upward move continues, the following targets can be considered:
🎯 $3.087
🎯 $3.855
🎯 $4.293
🎯 $4.792
🎯 $5.549
⚠️ Always remember to use a tight stop-loss and follow proper risk management.

ASTUSDT Forming Bullish MomentumASRUSDT is showing a powerful bullish momentum pattern that signals the possibility of a strong rally ahead. The price action is gaining traction with consistent buying volume, indicating growing confidence among traders and investors. This setup suggests that the pair could deliver a substantial up

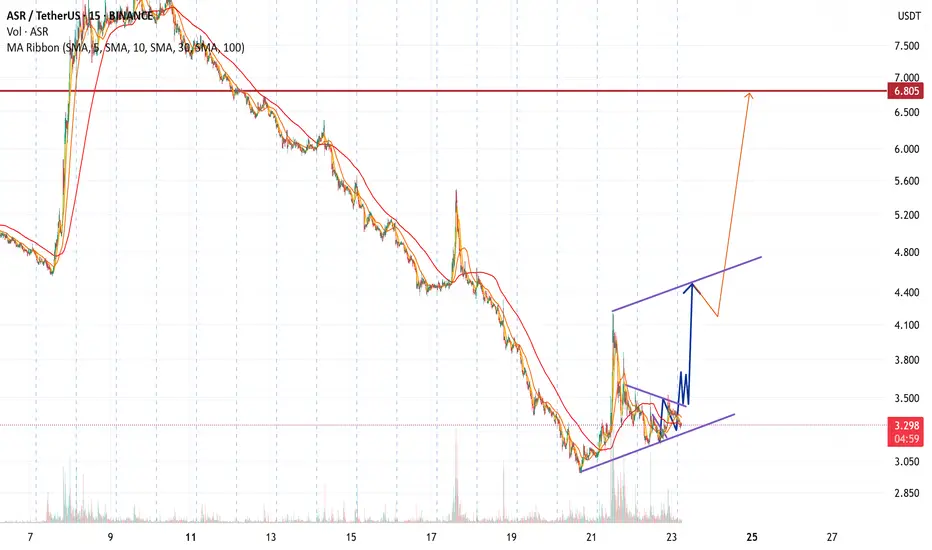
ASR/USDT technical analysisCurrent Market Overview
Current Price: $3.30
First Target (Resistance 1): $4.40
Second Target (Resistance 2): $6.80
Trend Context: The coin seems to be consolidating near the lows, with potential for a breakout if buying volume increases.
🔎 Step-by-Step Analysis
Identify Support & Resistance
$ASR Bottom Bounce: 4H Trading Plan with Oversold RSIBINANCE:ASRUSDT
Trading Levels:
Entry: 1.00 (4.420 USDT) - The level where the initial purchase is planned.
DCA (Dollar-Cost Averaging): 1.135 (3.832 USDT) - An additional buying point if the price declines.
SL (Stop Loss): 1.272 (3.235 USDT) - The level where the loss would be limited.
TP (Take

ASR fan token analysis
ASR FAN TOKEN LONG PSOT ON WAVE ANALYSIS
as far long a falling wedge pattern in trade 1 setup, in case we hit sl in 1 we go fro order blok for steup 2
other updater will soon
tp/sl is mentioned on charts
ASR Prints Higher High Eyeing Buy-Back ZoneASR has delivered a decisive breakout, printing a strong higher high and confirming bullish market structure. Current focus is on the designated buy-back zone for re-accumulation, aligning with the continuation bias. Should this zone fail to hold, the primary demand area below remains a strategic ac

ASR Bearish DivergenceBINANCE:ASRUSDT
Trade Setup:
Target 1: 3.883 (0.5 Fibonnaci Golden Zone).
Target 2: 3.190 (0.618 Fibonnaci Golden Zone).
Target 3: 2.204 (0.786 Fibonnaci Golden Zone).
Target 4: 0.948 (1 Fibonnaci).
Stop Loss: 6.817 (0 Fibonnaci).
RSI Analysis: The RSI is showing a bullish divergence, suggestin

ASRUSDT Forming Strong Bullish BreakoutASRUSDT has recently delivered a strong bullish breakout, continuing its upward momentum with an impressive surge above the critical resistance level. The price has maintained a steady climb, forming a sharp ascending structure supported by solid volume—an indication of growing investor confidence.

ASRUSDT Forming Falling WedgeASRUSDT is gaining strong bullish traction after a successful breakout from a falling wedge pattern. This setup is widely recognized in technical analysis as a bullish reversal structure, and the breakout here is backed by consistent price action above the key resistance zone highlighted in red. ASR

ASR/USDTKey Level Zone: 2.0500 - 2.0700
HMT v8.1 detected. The setup looks promising, supported by a previous upward/downward trend with increasing volume and momentum, presenting an excellent reward-to-risk opportunity.
HMT (High Momentum Trending):
HMT is based on trend, momentum, volume, and market str

See all ideas
Summarizing what the indicators are suggesting.
Oscillators
Neutral
SellBuy
Strong sellStrong buy
Strong sellSellNeutralBuyStrong buy
Oscillators
Neutral
SellBuy
Strong sellStrong buy
Strong sellSellNeutralBuyStrong buy
Summary
Neutral
SellBuy
Strong sellStrong buy
Strong sellSellNeutralBuyStrong buy
Summary
Neutral
SellBuy
Strong sellStrong buy
Strong sellSellNeutralBuyStrong buy
Summary
Neutral
SellBuy
Strong sellStrong buy
Strong sellSellNeutralBuyStrong buy
Moving Averages
Neutral
SellBuy
Strong sellStrong buy
Strong sellSellNeutralBuyStrong buy
Moving Averages
Neutral
SellBuy
Strong sellStrong buy
Strong sellSellNeutralBuyStrong buy