A Case Study : NaturalGas Probable price projectionMarket Participants play the role of
1. price discovery
2. shift in the trends and change of cycles
3. Value rotation among different asset classes
Market players like Yearly, Halfyearly, Quarterly, Monthly, weekly, Daily, Hourly, and Intraday participants who trade during certain time ranges.
Related commodities
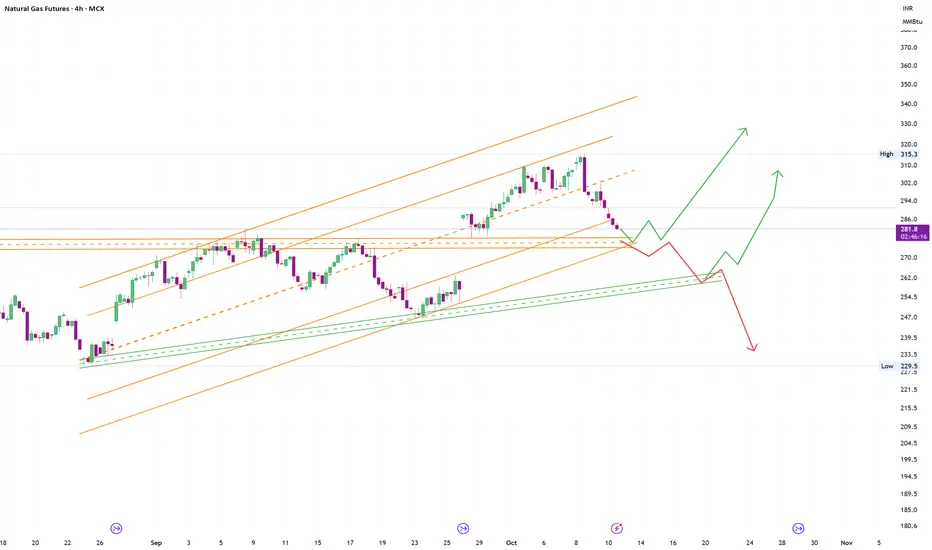
Naturalgas Probable price projection - pivot and trendlineCase 1:
If price takes support around 265-270 levels and sustains above pivot . Then price can move upside may be upto R1 .
Case 2:
If price sustaind below pivot and breaks the support may reach S1 .

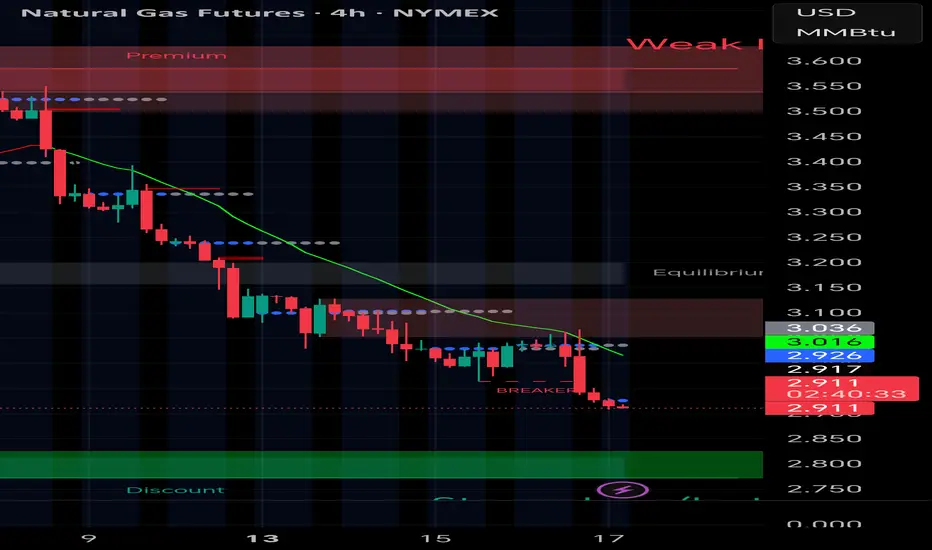
NATGAS (NYMEX): Entering Strong buy Zone – Upside Potential! 💰 Current Price: 2.912
📉 Accumulation Zone: 2.800 – 2.900
Natural Gas has entered a deep accumulation phase after a long consolidation.
The lower band at 2.800 makes it a high-probability buy zone for traders eyeing the next leg up.
---
🎯 Upside Targets
⚡ 3.200 → First resistance
🚀 3.400 – 3.5
Natural Gas (NG1) Make-or-Break Zone AheadEveryone’s watching Natural Gas right now and for good reason.
We’re sitting right at the edge of a big move.
Here’s the simple breakdown 👇
⚡ Hold above $3.00 → Price could chop around (consolidate) a bit.
🚀 Break above $3.56 → That opens the door to $4.10, and if momentum holds, even $5.40.
⚠️

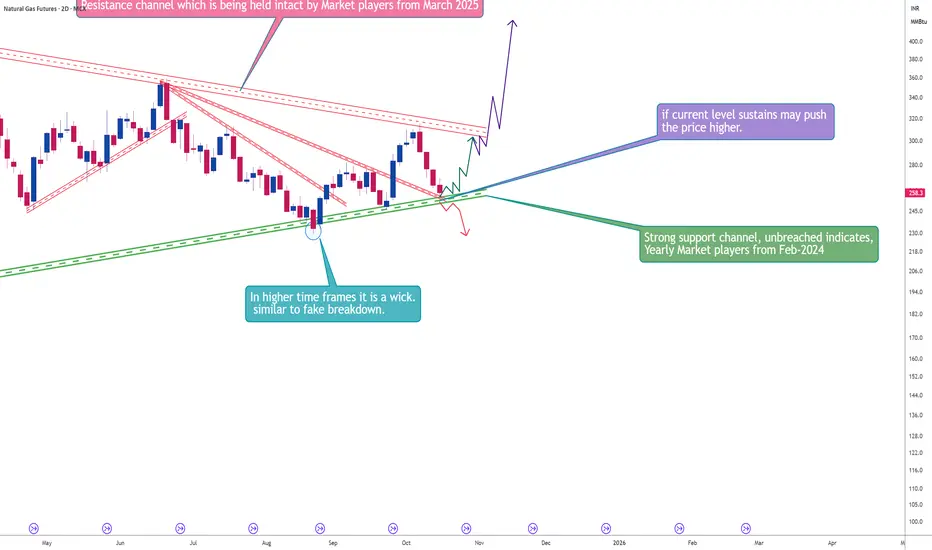
NaturalGas probable price movement 1. Natural gas is following a pattern and if it sustains above 280 may push the price up
2. if breaks down may cause price to go down.
Gold | Oil | Dollar | Natural Gas | Silver Price ForecastGold | Oil | Dollar | Natural Gas | Silver Price Forecast
NYMEX:NG1! NYMEX:CL1! COMEX:SI1! COMEX:GC1!

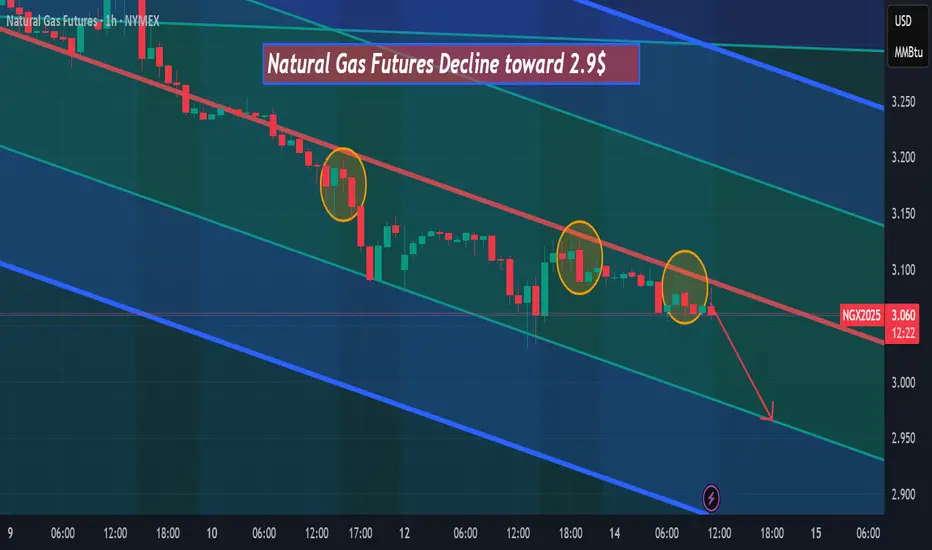
Natural gas futures are declining toward $2.90 Natural gas futures are declining toward $2.90 after three pullbacks on the bearish red trendline, according to my analysis on the 1-hour timeframe.
Sellers continue to dominate after the recent failure to hold above the bearish red trendline, increasing the probability of a move toward the $2.90 su
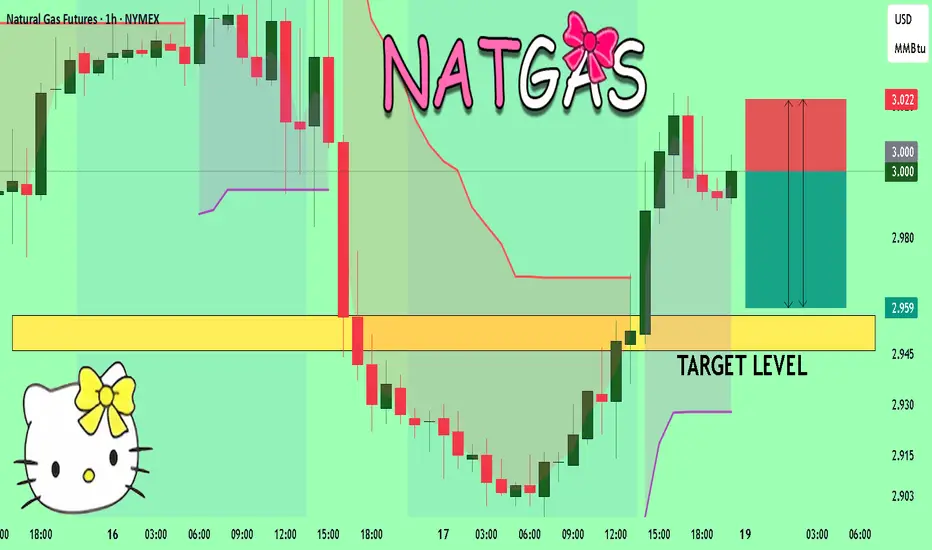
NATGAS Technical Analysis! SELL!
My dear subscribers,
This is my opinion on the NATGAS next move:
The instrument tests an important psychological level 3.000
Bias - Bearish
Technical Indicators: Supper Trend gives a precise Bearish signal, while Pivot Point HL predicts price changes and potential reversals in the market.
Target
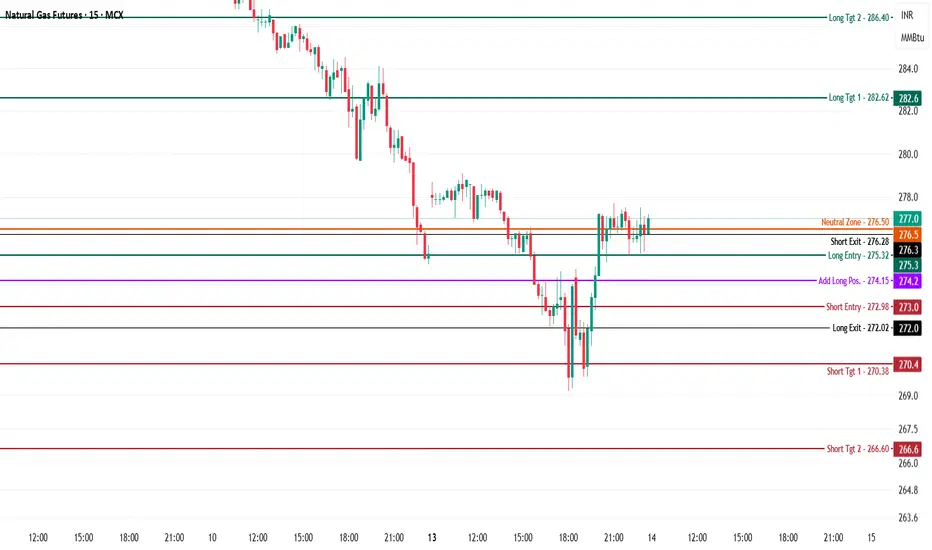
Natural Gas MCX Future - Intraday Technical Analysis - 14th Oct.$MCX:NATGAS — Chart Pathik Insights
These key levels are shared nightly to help fellow traders approach Natural Gas with clarity, structure, and discipline. The mission is simple — foster informed, logical market participation grounded in repeatable analysis.
Natural Gas is currently observed near
NATURAL GASPreferably suitable for scalping and accurate as long as you watch carefully the price action with the drawn areas.
With your likes and comments, you give me enough energy to provide the best analysis on an ongoing basis.
And if you needed any analysis that was not on the page, you can ask me with a

See all ideas
Summarizing what the indicators are suggesting.
Neutral
SellBuy
Strong sellStrong buy
Strong sellSellNeutralBuyStrong buy
Neutral
SellBuy
Strong sellStrong buy
Strong sellSellNeutralBuyStrong buy
Neutral
SellBuy
Strong sellStrong buy
Strong sellSellNeutralBuyStrong buy
A representation of what an asset is worth today and what the market thinks it will be worth in the future.
Displays a symbol's price movements over previous years to identify recurring trends.
Frequently Asked Questions
The current price of ASX Victorian Wholesale Gas Futures is 11.05 AUD / GJO — it hasn't changed in the past 24 hours. Watch ASX Victorian Wholesale Gas Futures price in more detail on the chart.
Track more important stats on the ASX Victorian Wholesale Gas Futures chart.
Open interest is the number of contracts held by traders in active positions — they're not closed or expired. For ASX Victorian Wholesale Gas Futures this number is 13.00. You can use it to track a prevailing market trend and adjust your own strategy: declining open interest for ASX Victorian Wholesale Gas Futures shows that traders are closing their positions, which means a weakening trend.
Buying or selling futures contracts depends on many factors: season, underlying commodity, your own trading strategy. So mostly it's up to you, but if you look for some certain calculations to take into account, you can study technical analysis for ASX Victorian Wholesale Gas Futures. Today its technical rating is sell, but remember that market conditions change all the time, so it's always crucial to do your own research. See more of ASX Victorian Wholesale Gas Futures technicals for a more comprehensive analysis.