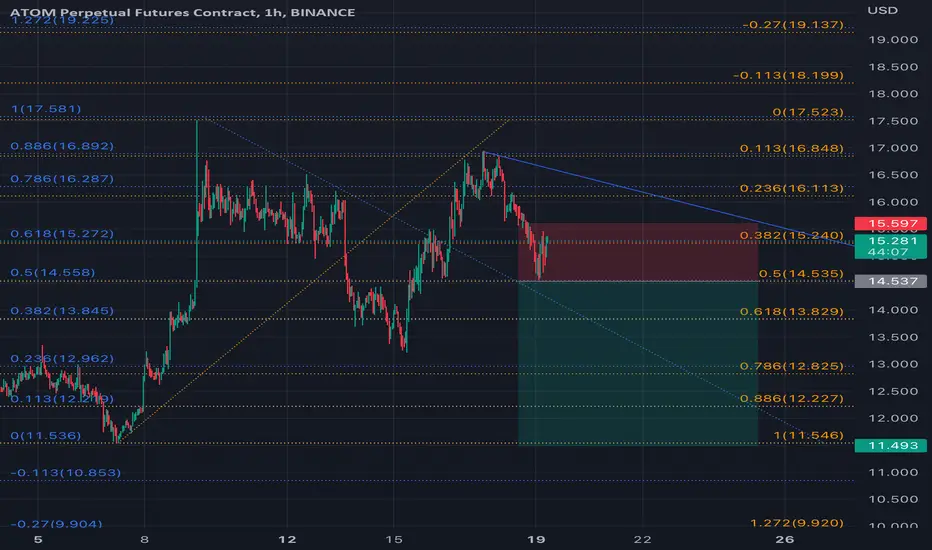
ATOM - Testing short term supportSince the beginning of the week prices gives alert signal, with a breakout of daily Kijun.
Currently, test of the short term trendline. If it breaks, beware of the trend reversal with 12.29$ as a first target then 11.70$ .
Also, daily cloud isn't that far, if we go below, back in bears territory.
Trade ideas

ATOM 4H MA200Atom continues to hold the 4H MA200 and bounce off of it as it has done for the past month. With the Daily MA200 rolling down to the current price, it is possible Atom could break this level. If it does, it would make a rewarding short. Wait to see.

ATOM/USDT Weekly Bear FlagATOM-USDT | Bear Flag on Weekly chart . Pair need to break 12.90 support for downtrend. if it breaks then it will go down to 9.90 - 6.60 . Pair could be in range from 12.90 to 18.00 for short period.
Now a days market is liquidating lot of accounts. So use your money very carefully.
Note
Use your money carefully and don't be greedy. Its just my opinion, not a financial advice.
Thank you and Good Luck!

ATOM to $60On the above 2-day chart price action has corrected almost 90% since the year began. A number of reasons now exist to be long, including:
1) The ‘incredible buy’ signal prints.
2) Price action testing past resistance as support.
3) 1 & 2 is also true for the 3-day BTC pair (below).
4) ATOM price action finds itself on the ‘what if’ list. I don’t know how, but that’s the fact of the chart.
Is it possible price action falls further? Sure.
Is it probable? No.
Good luck!
Ww
Type: trade
Risk: <=6% of portfolio
Timeframe: 4 to 7 months
Return: 10x
3-day BTC pair

$ATOM short updateIf $ATOM closes this daily candle above $14.2. I'll consider closing my short.
Otherwise I think this downtrend continues.

ATOM is looking absolutely stunning!Let’s take a look at ATOM. All drawing tools drawn on the weekly time frame. But wanted to see how the daily time frame is looking.
Daily chart looks absolutely primed and ready for a big movement. ATOM looks bottomed out on the daily and weekly time frames.
Fully expect for ATOM to start making its movement to .618 fib at $22.80 level. Red box of resistance definitely needs to be retested. If these two movements come through then I’d expect a witch to the .786 at $27.50
Take profits off the table at .618, red resistance box and lastly at the .786 then set a trailing stop loss.
Again ATOM has huge upside potential! Trade safe!
What’s everyone think?

ATOM : Daily chart update Dear Cosmonauts,
Since the last few days and the volatility of the current market, Atom remains strong, for the moment.
Currently, Daily Kijun isn't broken yet. And prices are invalidating the sell signal (given by a break of daily Kijun).
So, 13.67$ is the main support. If this one breaks, then 12.79$ is the next support.
The next few hours will be important !
Cheers.

S/R Atom until release shared securityThis my idea to swing trade for ATOM. Atom currently strong demand, i trying to get profit as i can in from atom

ATOM 5 wave correction of larger timeframe Double TopATOM 5 wave correction of larger timeframe Double Top.
Will come back to the possible neck line of the double top and if it fails it will go towards the $11.50 area.
Thought?

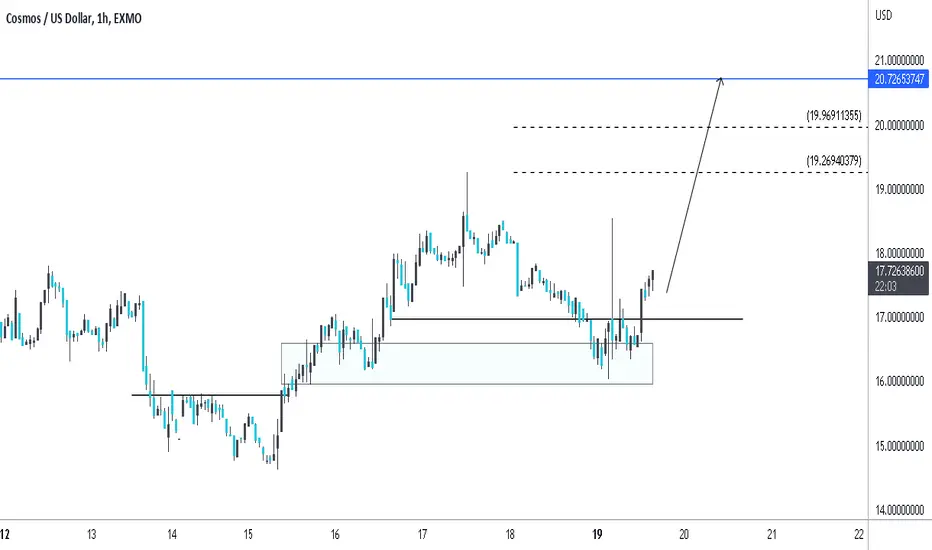
ATOMUSD Looking UpATOMUSD looks bullish with two prices ahead. Some monitoring will be required as it pushes up.
ATOM/USD 4HR-3HR Diamond4HR-3HR Diamond Maturing. We have a great potential long setup with a TD 9 as of just 3-4 candles ago and a A13 Communicating this volatility is not done and that we are about to exit this pattern. We have measured the potential of the moves to come.
Pretty steep for both ways so yeah, crazy but... I'm just gonna go on a Limb here because of these current conditions, also because the diamond is slanted to the downside. I'm gonna say Long on this one.
side note, We have a Weekly TTM Squeeze firing as of 2 and 1/2 weeks ago to the Upside.

ATOM 4day chart Death CrossI'm concerned that there is a death cross on the 4 day chart for Atom. This asset has had significant gains since the 2020 bull run and Luna 1.0 renamed Luna Classic is on the Atom network. I'm not sure how the 2 crypto assets are correlated but I do know that Atom hasn't taken an underwater dive yet and with this fresh death cross on September 6th, 2022 I would recommend anyone to be cautious if holding in this position. I wouldn't be surprised it Atom plummeted to 0.16 cents on the dollar.

ATOM - 1 Hour - Sell SignalHere was the sign to sell. There was a steady pump.. a red engulfing candle was printed.. trend was not able to break above the previous high and the sell-off happened.

ATOM : We found a resistance serAfter a massive bounce, prices found a resistance identified a few weeks ago.
This resistance is still strong and blocked prices twice in a row.
Technically, the main suppor is still the flat of daily Kijun, at 13.67$ . And the uptrend isn't in danger while prices remains above the daily cloud.
If the resistance quoted above is broken, 19.4$ as a second target.
Cheers Cosmonauts !

ATOM, double top short-term decline.The following are machine translations:
On the daily chart, it is a bullish trend along the trend line. It is currently blocked twice near 17, and it may form a double-top short-term decline.
The indicator macd is dead fork, and the RSI indicator is distributed downward above the neutral 50.
Summary: The local double top plus bearish indicator may fall back to the lower uptrend line in the short-term.

Atom maybe go back to 8.6 The main trend of the market is the long-term downtrend, Atom maybe go back to 8.6 in 4h chart soon

$ATOM to $12 before $20ATOM has been on a tear but momentum looks to be fading. I think it sees $12 before $20.

~$11 ATOM before relief bounce?Picture paints a thousand words, if ATOM breaks the neck line of $13.3, down to $11.45 which is also the 0.5 fib retrace before expecting any bounce.

ATOM MA 200 and EMA 8Atom's inability to hold the MA200 leaves little reason to be bullish. It is however still holding the EMA8. If Atom loses the EMA8 and fails to regain the MA200, expect much further downside ($5.50)

Cosmos Double Top and 1hr bearish divergenceThoughts on ATOM?
Cosmos still has a Double Top and 1hr bearish divergence in play

ATOM's drop of 60%Long correction WXYXZ is over, 80d and now as the whole market looks to south, so does ATOM.
ATOM should go at least to the same low of June but ideally make a lower low.
How far does it go? Who knows, but zone around 5 should give some support.
Good luck trader!

Perfect possible Double Top into the Cosmo?ATOM/USD
Bearish Case
- Double Top can be seen (white line)
- 1hr and 8hr RSI shows a exaggerated bearish divergence
- BTC is retracing, eventually ATOM will follow to in this bear market
Target Zone
- $13.41 (neck line of the bottom of double top)
- $12.81 (0.618 fib retrace)
- $11.60 (0.5 fib retrace & start of double top)
Bullish Case
- May break higher 8hr Histogram showing reversal
Thoughts?
