The Problem With Crypto – Part 1: Centralized 'Exchanges'🧠 The Problem With Crypto – Part 1: Centralized Exchanges
It actually took me a while to decide what title to give this post.
Because every single one of these would fit:
-The Exchange Illusion
-The Liquidation Machine
-The Centralized Harvest
-Inside the Casino
-How Exchanges Always Win
-Where Did Your Money Go? 💰
-They Say They’ll Compensate You… So Who’s Holding Your Cash?
-The Perfect Crime Nobody Talks About 🎭
-Your Loss = Their Profit
-The Casino Always Wins 🎰
And honestly… they’re all partially — or maybe wholly — true.
💥 About Friday’s Crash
Friday’s collapse wasn’t random.
It wasn’t “volatility.”
It was a harvest event — engineered by liquidation engines that feed the exchanges.
Coins didn’t drop 50–60 % because of news — they dropped because leverage met latency, and the house collected the pot.
👩🏫 A Question From My Student
One of my community members, Sarah, asked me:
“Professor, how did this even happen? How can small-leverage positions just disappear?”
So here’s the truth — no sugar-coating. ☕💀
🎭 The Illusion of Liquidity
When you see a coin drop 50–60 % in minutes, that’s not price discovery — it’s engineered implosion.
Exchanges create the illusion of deep liquidity, but when panic hits, that liquidity vanishes faster than your stop-loss button.
They brag about billions in open interest, but that’s just leveraged ghost money.
On a 100× market, $10 million in deposits looks like $1 billion of “open interest.”
A 1 % move = total collapse of the stack.
🧨 How the Domino Falls
1️⃣ Market dips 1–2 %.
Liquidation bots start killing over-levered longs.
2️⃣ Those positions don’t close quietly — the system market-sells them, pushing price lower and triggering the next wave.
3️⃣ Within seconds you have a cascade — a healthy market turns into a slaughterhouse.
That’s how you get –60 % in five minutes on a coin with no news, no hack, no reason.
🏦 The Exchanges’ Dirty Secret
They love these crashes.
Because every liquidation = trading fee + funding reset + spread capture.
They collect the liquidation fee (usually 0.5–1 %).
They resell your collateral into thin order books.
Their own market makers scoop up panic liquidity at discounts.
Then the price “recovers” 30–40 % like nothing happened.
It’s not volatility — it’s profit harvesting disguised as market action.
🧮 “But It’s the Trader’s Fault, Right?”
That’s the official line.
They’ll say, “You were liquidated because you took too much risk.”
But here’s what nobody explains:
Your liquidation price often triggers before your stop-loss — sometimes way before.
Let’s say you open a position with $100 using 50× leverage.
Your exposure is $5 000.
You’d expect to only lose that $100 if the market moves 2 %.
Instead, the exchange liquidates you when your position drops about 75 % of your margin,
so you’re wiped out on a 1.5–2 % move — while the chart barely twitches.
Now compound this:
If you scale or DCA into a trade, the liquidation engine recalculates your threshold even closer —
often within 10–15 % of normal price action.
Meaning your trade could still have equity left, but the exchange force-closes it,
sells it into the book, and keeps the rest.
And here’s the question no one dares to ask:
👉 If these exchanges have AI, algorithms, and “smart risk engines,”
why don’t they auto-close your position when you’re down 10–15 % and just take the loss?
Why do they wait until liquidation — when the trader loses 100 % and the exchange keeps the remainder?
Where does that extra money go?
It doesn’t vanish.
It’s absorbed by the exchange’s insurance and profit pools — the same ones that market makers draw from.
In other words, they could have saved you at minus 15 %,
but they chose to liquidate you at minus 100 % because it pays them better.
That’s not a trading platform.
That’s a profit engine disguised as protection.
(in Part 3 we will examine a lot more closely into this and other factors like how order books work and WHO sets them UP!!!!)
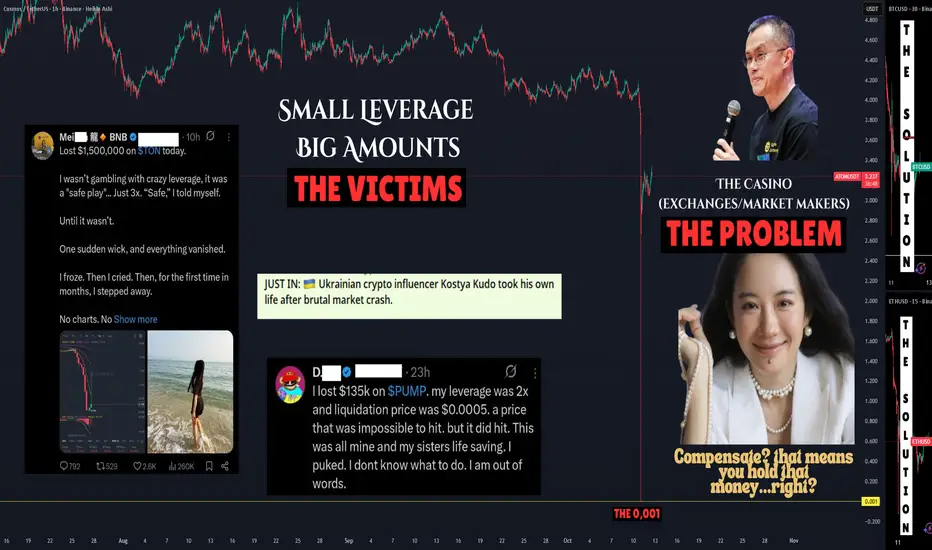
🩸 Small Leverage, Big Losses
People think “2× or 3× is safe.”
It wasn’t.
Friday proved that even low leverage isn’t safe when the exchange controls the price feed.
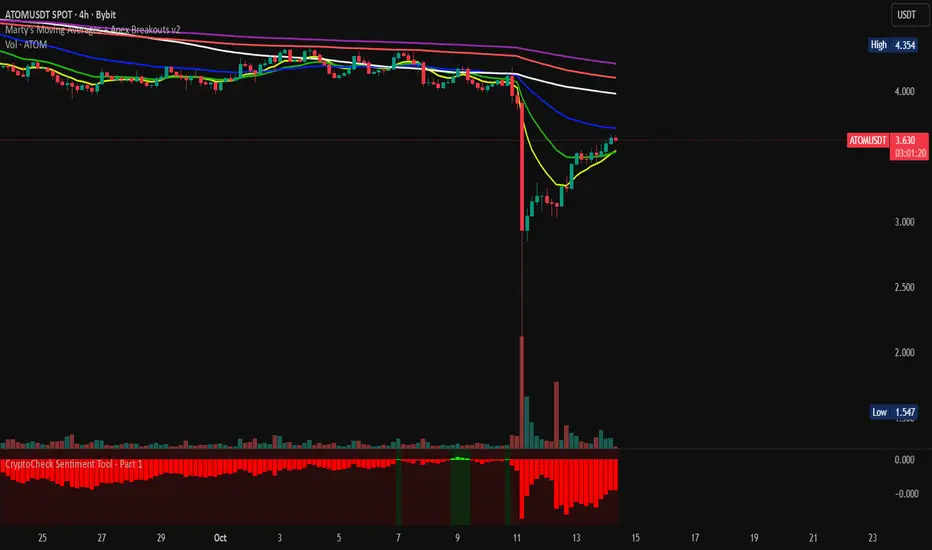
We saw NASDAQ:ATOM , NYSE:PUMP , and others hit zero ticks on Binance.
That’s not a market event — that’s a systemic failure or an engineered flush.
One trader lost $135 K at 2×.
Another lost $1.5 M at 3×.
These aren’t degens — they’re victims of a broken system.
💬 Community Voices Demanding Answers
Even the Turkish crypto community (and I'm 100% Greek by the way) publicly asked CZ:
“How can altcoins crash 90 % in seconds when no one sold?
How can prices nuke without real volume?
And why did tokens not listed on exchanges stay safe?”
These are valid questions.
And Binance, Bybit, MEXC and the rest — owe us PROPER answers.
🧾 The Yi He Statement
Yi He, co-founder and Chief Customer Service Officer of Binance — the public face of the company after CZ — finally spoke.
She said:
“We’ll address losses case-by-case.
We won’t compensate for price fluctuations or unrealized losses.”
Now, read that carefully.
Translation: We hold the money and decide who gets it back.
If Binance can “compensate,” that means the liquidated funds didn’t vanish — they were captured and are still inside the system.
And that raises the obvious question:
👉 Where does all that liquidation money actually go?
Yi He’s post feels like the moment when you lose at a casino, the dealer miscounts the chips, and management says, “Don’t worry, we’ll review your case individually.”
You know the money never left the casino.
So is it the same here?
Do the exchanges hold these funds?
How are they redistributed?
We need clear answers — from Yi He herself, from CZ, and from every exchange that claims to be transparent.
It’s time they step forward and explain how these liquidation systems truly work — because people lost life savings, and silence isn’t customer service.
⚙️ The Mechanics Behind the Scenes
1️⃣ When you’re liquidated, your collateral is sold instantly into the order book.
2️⃣ That money moves into the exchange’s insurance fund.
3️⃣ The insurance fund feeds market makers to “stabilize” prices.
4️⃣ The exchange earns fees on each loop.
It’s a closed system where every loss feeds their balance sheet.
🧯 The Verdict
-Friday’s crash wasn’t a bug.
-It was a business model.
-A perfect harvest executed in 24 hours.
While millions lost life savings, exchanges collected fees, spreads, and collateral — and then tweeted “systems functioned normally.”
Until there’s transparency on liquidation flows, public insurance fund audits, and a ban on exchange-owned market makers, this will happen again.
💙 Final Word
To every retail trader who lost money on Friday — you weren’t reckless.
You were caught in a system designed to protect itself first and you last.
This is only Part 1 of The Problem With Crypto.
There will be at least two more parts, because this story runs far deeper than one flash crash.
I originally planned to release this series at the end of October,
but what happened on Friday forced me to start early.
The truth couldn’t wait.
Part 2 will dive into the unregulated, decentralized perpetual DEXs —
names like Aster, Hyperliquid, and others — platforms offering anonymity to insider traders and quietly damaging the market from multiple angles.
Part 3 will expose the market-maker cartels and their connections to the exchanges,
showing how price control and “liquidity partnerships” have become the hidden layer of manipulation behind every listing.
But it won’t end in darkness.
Because every cycle — like in the ancient Greek tragedies — follows the same path:
Ύβρις → Άτη → Νέμεσις → Κάθαρσις
(Hubris → Delusion → Retribution → Catharsis)
We’re living through Νέμεσις now — the correction phase.
The arrogance, the greed, the manipulation — they’re being exposed.
And what comes next is Κάθαρσις — purification and renewal.
That’s where the good side of crypto will rise again:
cleaner, fairer, more transparent.
Crypto doesn’t need to burn — it just needs to evolve.
And it will.
👉There are some truths I can’t fully share here — TradingView has its limits
and I’ve been banned before for saying too much or crossing lines. (can't advertise and sharing links might appear like that, so i won't risk it, sorry!)
So I’ll explain everything I can’t post here in a separate, long-form video soon (I am allowed to post my links here so follow those).
Stay tuned — because this story is just another day of progress 👩🏫 :
For those who remember my post from November 2022 — “Just another delay: Bitcoin will prevail” —
I’ll say it again, two years later, with even more conviction:
It was never the end.
It was only Nemesis on the way to Catharsis.💙💙💙
Bitcoin — and the real spirit of crypto — will prevail. 💙💙
As for the exchanges: It's your time to get your Token2049 parties aside and start thinking and acting right, like there IS a tomorrow! Start with giving your side of the story, explanations.
One Love,
The FX PROFESSOR 💙
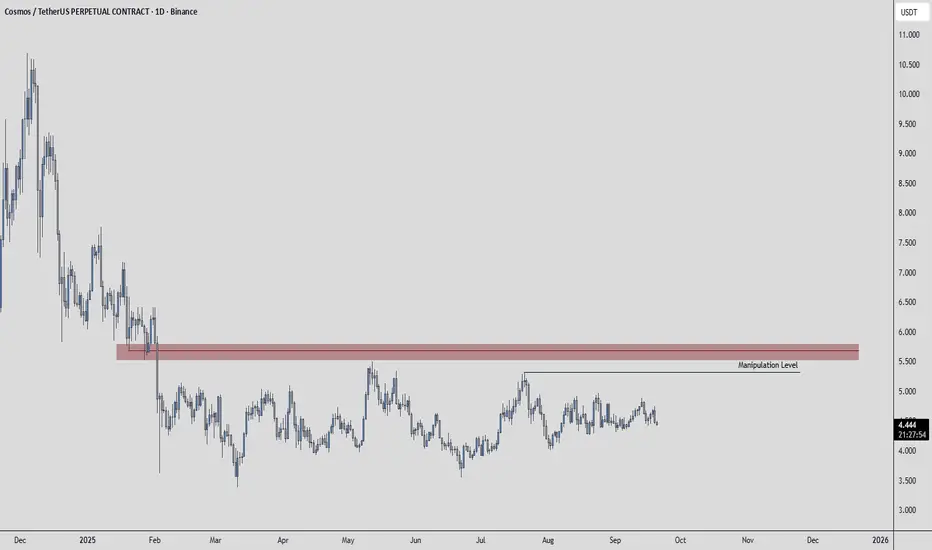
PS. This ATOM to 0.001 chart should first hunt you (👉 你 (nǐ)) — and then it should never happen again in crypto.
The tech is there to make crypto what it’s supposed to be — use it and stop abusing it.
Every problem has a solution. 🔧
ATOUST trade ideas
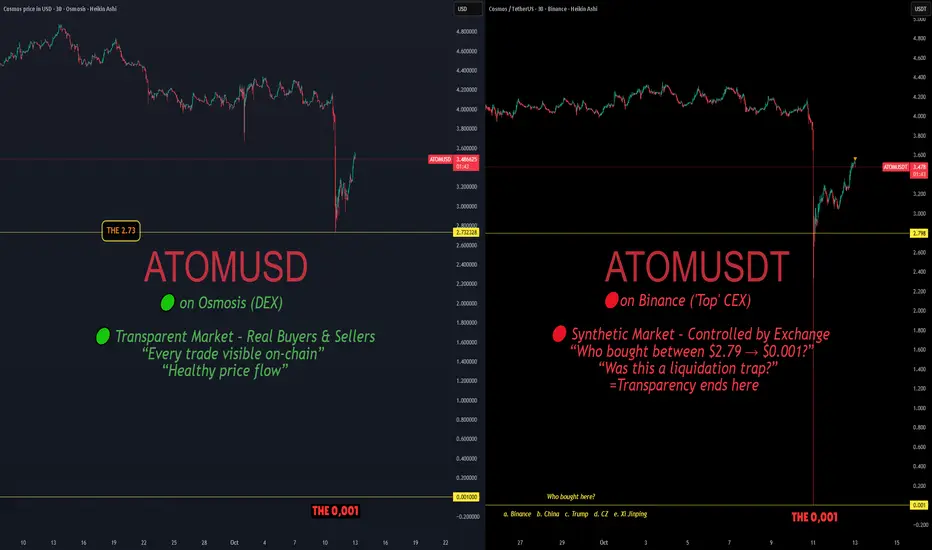
The Problem With Crypto –Part2: The Illusion of Decentralization🧠 The Problem With Crypto – Part 2: The Illusion of Decentralization
Same token.
Same moment.
Two realities.
🟢 ATOM/USD on Osmosis (DEX)
Transparent market — every trade visible on-chain.
Real buyers. Real sellers. Healthy price flow.
🔴 ATOM/USDT on Binance (CEX)
Synthetic market — controlled by the exchange.
Price collapsed to 0.001 USDT.
Who bought there?
Was it a trader, a market maker… or the house itself?
If it was the exchange — we deserve answers.
If it was a “partner” — expose it.
If it was “normal system behavior,” then the system is built to harvest.
On-chain markets move by human action.
Off-chain markets move by design.
And behind that design… there’s the Dragon behind the curtain. 🐉
We’ll dive deeper into that in a next episode.
One Love,
The FXPROFESSOR💙
TradeCityPro | ATOMUSDT Ready for a Sharp Drop!👋 Welcome to TradeCityPro Channel!
Let’s analyze ATOM (Cosmos) — one of the older and more established coins in the market. Personally, I’ve been holding and staking this one for quite a while.
🌐 Overview of Bitcoin
Before we begin, let me remind you that we’ve moved the Bitcoin analysis section to a separate daily report at your request, so we can go into more detail about Bitcoin’s condition, price action, and dominance:
📊 Higher Time Frames
On the higher time frames, ATOM has been ranging for a long period of time and interestingly, it has even formed a smaller range inside its main range.
Currently, it’s oscillating near the bottom support of that larger range, showing weakness.
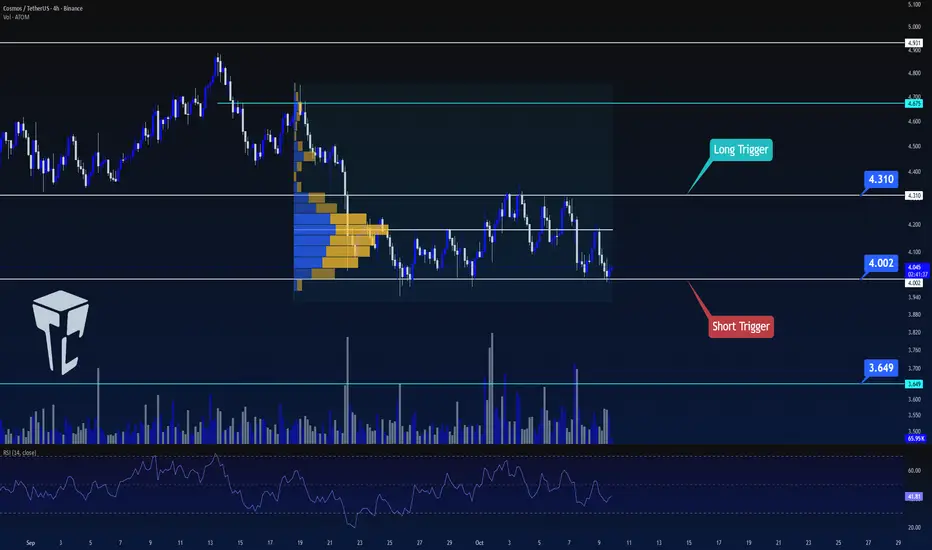
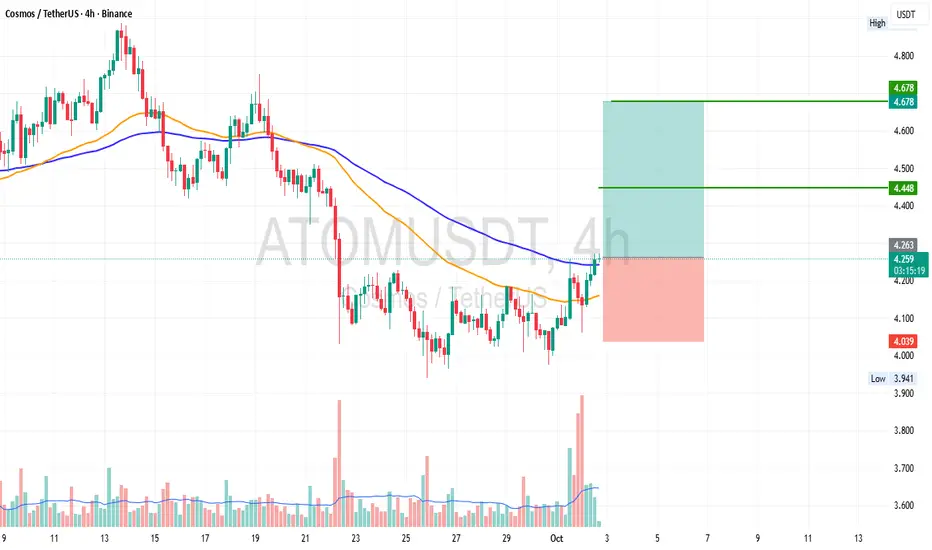
🕓 4H Time Frame
In the 4-hour chart, the price remains stuck inside a range between $4.002 and $4.310.
However, this time it has been rejected from the midline, which increases the likelihood of losing the lower support.
📉 Short Position Setup
If the price breaks below $4.002 with increasing volume and momentum, opening a short position would be completely logical and I’ll personally be taking that short setup as well.
📈 Long Position Setup
For a long position, patience is key.
Other coins like MNT, HYPE, and AVAX currently show stronger bullish potential, but if ATOM breaks above $4.310 and starts forming higher highs and higher lows, we can then begin to shift our bias to bullish.
📝 Final Thoughts
Stay calm, trade wisely, and let's capture the market's best opportunities!
This analysis reflects our opinions and is not financial advice.
Share your thoughts in the comments, and don’t forget to share this analysis with your friends! ❤️
ATOMUSDT 1D#ATOM is trading within a symmetrical triangle on the daily chart. In case of a breakout above the triangle resistance, the potential targets are:
🎯 $4.908
🎯 $5.319
🎯 $5.729
🎯 $6.312
🎯 $7.056
⚠️ Always remember to use a tight stop-loss and maintain proper risk management.

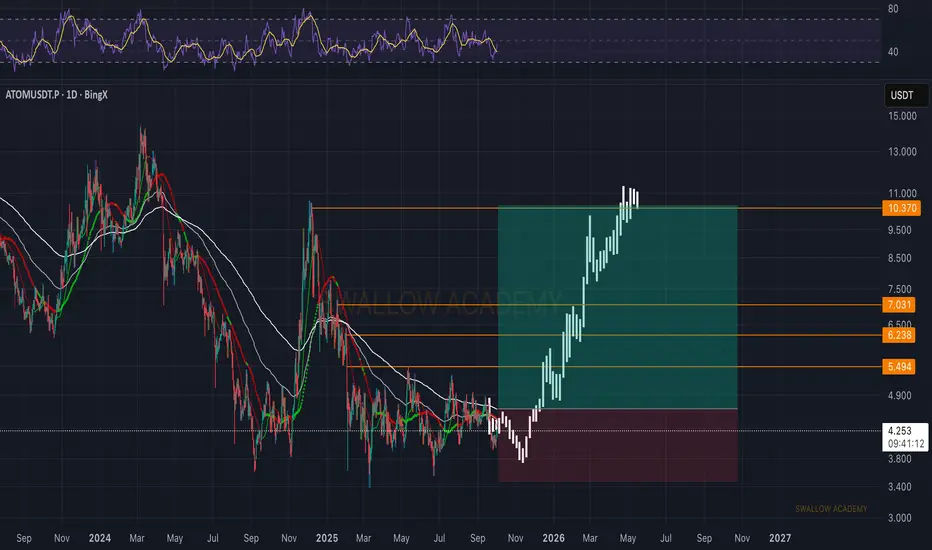
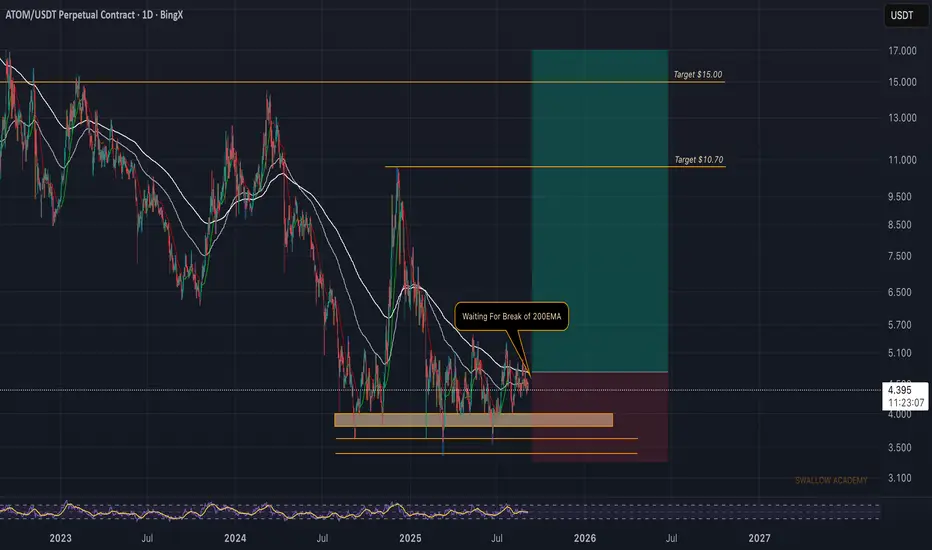
Cosmos (ATOM): Looking For Break of 200EMA | Bullish GameplanATOM has shown a strong bounce from the bottom zone and buyers have taken full control, driving the price back above key EMAs and straight into recovery mode. Current focus is the $10.3 resistance zone, which will act as the main level to watch. A clean breakout here could open the way toward higher continuation, while any rejection would likely pull price back to retest $7–$6.2 as support.
Swallow Academy
ATOM 4H Trade ideaATOM is going good. We can execute long trade here. Entry & Exit points are given on chart. NFA DYOR
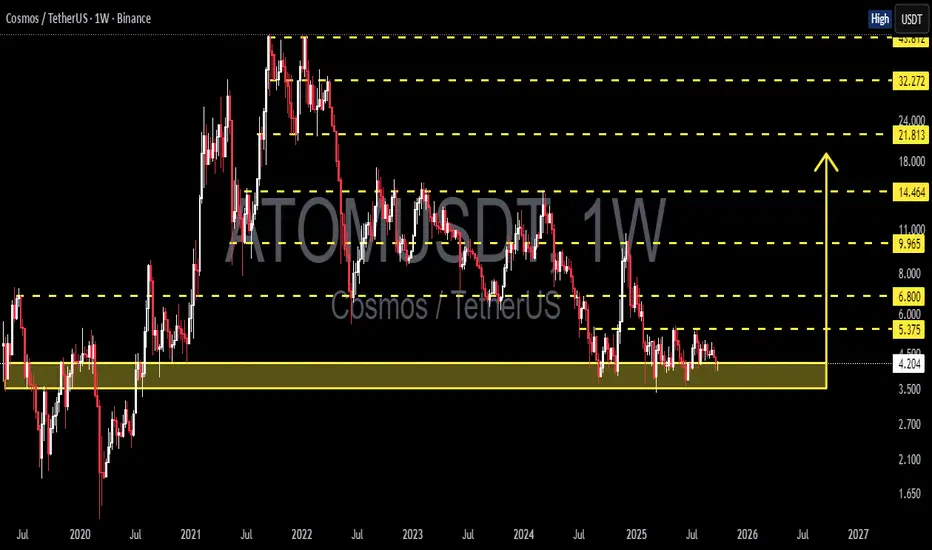
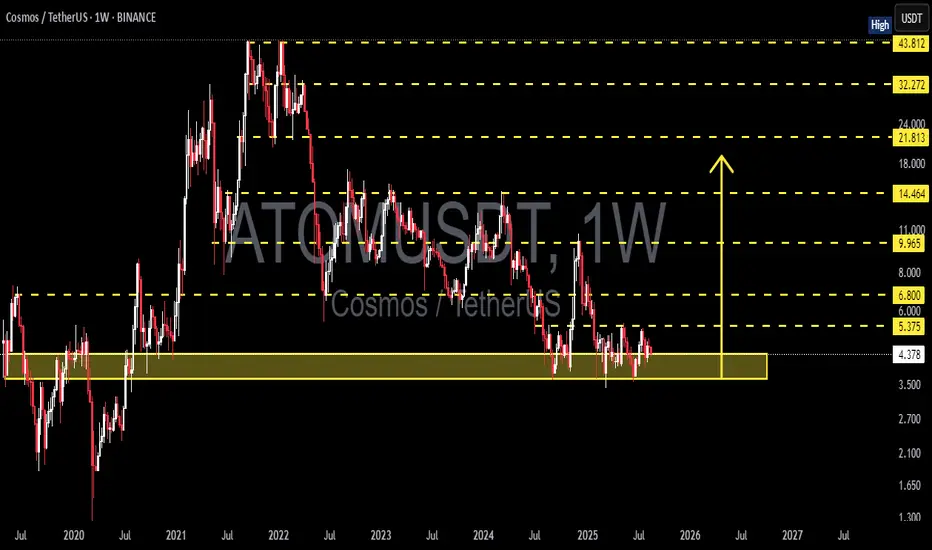
ATOMUSDT — Holding at Historical Support, Rebound or Break Down?📊 Overview
The Cosmos (ATOM/USDT) Weekly chart is at a decisive point. Price is currently sitting inside the historical support zone around 3.5 – 4.5 USDT, which has acted as a strong defense since 2020. Every time ATOM touched this area, a rebound followed — but this time the repeated tests suggest the support is getting weaker.
The macro structure still shows a pattern of lower highs since the 2021 peak, indicating a dominant bearish bias. However, the prolonged pressure has also pushed ATOM into an attractive long-term accumulation zone — if the support holds.
---
🔑 Key Technical Levels
Main Support Zone (Current): 3.5 – 4.5 USDT
Next Support: 2.7 USDT (structural low from 2020)
Resistance 1: 5.375 USDT
Resistance 2: 6.800 USDT
Resistance 3: 9.965 USDT
Major Resistances: 14.464 – 21.813 – 32.272 – 45.612 USDT
These levels provide the roadmap for ATOM’s mid-to-long-term direction.
---
🟢 Bullish Scenario
1. Confirmation: a weekly close above 5.375 – 5.5 USDT with strong volume.
2. Implication: signals that selling pressure is fading and the support zone has held.
3. Targets:
Initial: 6.8 USDT
Mid-term: 9.965 USDT
Extended: 14.4 – 21.8 USDT if market momentum strengthens.
4. Pattern potential: a double bottom or accumulation base may form if the zone continues to hold and buyers step in aggressively.
---
🔴 Bearish Scenario
1. Confirmation: a weekly close below 3.5 USDT.
2. Implication: breakdown of historical support → opens the path for deeper downside.
3. Targets:
First: 2.7 USDT (2020 structural support).
Extended: 2.1 – 1.6 USDT if selling accelerates.
4. Warning: repeated testing of the same support weakens it, making a breakdown scenario highly possible if buyers fail to defend.
---
📌 Structure & Pattern Insights
Horizontal consolidation within support zone, small weekly candles → market indecision.
Lower highs keep pressuring the structure downward.
Potential double bottom if ATOM holds above 3.5 and reverses strongly.
Beware of false breaks — always confirm with volume and retest.
---
🎯 Trader & Investor Takeaways
Short-term traders: watch closely for reaction inside 3.5–4.5. Aggressive entries possible here with tight stops below 3.3. Safer entries only after a weekly close above 5.5.
Long-term investors: this zone is historically a strong accumulation area, but patience and risk management are crucial due to breakdown risks.
Strategy: scale into positions gradually, risk max 1–2% per trade, and rely on weekly confirmation.
---
📝 Conclusion
ATOM is at a crossroads. Holding the 3.5–4.5 support zone could spark a rebound toward 6.8 – 10 USDT, while a confirmed breakdown below 3.5 would expose ATOM to 2.7 or even lower.
The next weekly close will likely decide the medium-term trend. ATOM now stands like a last fortress under siege — either it defends and rallies, or it crumbles into deeper lows.
---
#ATOM #Cosmos #ATOMUSDT #Crypto #TechnicalAnalysis #PriceAction #SupportResistance #CryptoMarket #SwingTrading #InvestInCrypto
ATOM recoveryAtom recovery, I expect it to continue climb maybe another slight correction and then more upside. Hard to tell where a tight entry would be.
ATOMUSDT | Short From Red Box, Long-Term SetupResistance Zone
ATOMUSDT is facing heavy resistance at the red box, making it an attractive short entry zone. Structure shows sellers remain active here, and momentum hasn’t shifted yet.
Risk Management
For risk management, I’m anchoring this setup with a stop at 7.9. That level is key — a breakout and retest above it would invalidate the short idea and open the door for bullish continuation.
Bias and Conditions
Until then, the bias stays short. CDV is not showing strong buyer commitment, and footprint still reflects selling pressure. As long as those conditions hold, the short idea has weight.
Trade Style
This is a long-term play, not a quick scalp. Patience is required.
📌I keep my charts clean and simple because I believe clarity leads to better decisions.
📌My approach is built on years of experience and a solid track record. I don’t claim to know it all but I’m confident in my ability to spot high-probability setups.
📌If you would like to learn how to use the heatmap, cumulative volume delta and volume footprint techniques that I use below to determine very accurate demand regions, you can send me a private message. I help anyone who wants it completely free of charge.
🔑I have a long list of my proven technique below:
🎯 ZENUSDT.P: Patience & Profitability | %230 Reaction from the Sniper Entry
🐶 DOGEUSDT.P: Next Move
🎨 RENDERUSDT.P: Opportunity of the Month
💎 ETHUSDT.P: Where to Retrace
🟢 BNBUSDT.P: Potential Surge
📊 BTC Dominance: Reaction Zone
🌊 WAVESUSDT.P: Demand Zone Potential
🟣 UNIUSDT.P: Long-Term Trade
🔵 XRPUSDT.P: Entry Zones
🔗 LINKUSDT.P: Follow The River
📈 BTCUSDT.P: Two Key Demand Zones
🟩 POLUSDT: Bullish Momentum
🌟 PENDLEUSDT.P: Where Opportunity Meets Precision
🔥 BTCUSDT.P: Liquidation of Highly Leveraged Longs
🌊 SOLUSDT.P: SOL's Dip - Your Opportunity
🐸 1000PEPEUSDT.P: Prime Bounce Zone Unlocked
🚀 ETHUSDT.P: Set to Explode - Don't Miss This Game Changer
🤖 IQUSDT: Smart Plan
⚡️ PONDUSDT: A Trade Not Taken Is Better Than a Losing One
💼 STMXUSDT: 2 Buying Areas
🐢 TURBOUSDT: Buy Zones and Buyer Presence
🌍 ICPUSDT.P: Massive Upside Potential | Check the Trade Update For Seeing Results
🟠 IDEXUSDT: Spot Buy Area | %26 Profit if You Trade with MSB
📌 USUALUSDT: Buyers Are Active + %70 Profit in Total
🌟 FORTHUSDT: Sniper Entry +%26 Reaction
🐳 QKCUSDT: Sniper Entry +%57 Reaction
📊 BTC.D: Retest of Key Area Highly Likely
📊 XNOUSDT %80 Reaction with a Simple Blue Box!
📊 BELUSDT Amazing %120 Reaction!
📊 Simple Red Box, Extraordinary Results
📊 TIAUSDT | Still No Buyers—Maintaining a Bearish Outlook
📊 OGNUSDT | One of Today’s Highest Volume Gainers – +32.44%
📊 TRXUSDT - I Do My Thing Again
📊 FLOKIUSDT - +%100 From Blue Box!
📊 SFP/USDT - Perfect Entry %80 Profit!
📊 AAVEUSDT - WE DID IT AGAIN!
I stopped adding to the list because it's kinda tiring to add 5-10 charts in every move but you can check my profile and see that it goes on..
atomusdtThe atom currency is moving in a triangle and a break from above could move to $5.6 and $6.3. The targets are clear.

Cosmos (ATOM): About To Go Parabolic | Bullish AFThe key zone on ATOM is that 200 and 100 EMA, which, upon seeing broken, we should see a good upside movement!
More in-depth info is in the video—enjoy!
Swallow Academy

ATOM to $16With breaking the resistance at 6.20, I think Atom can go to the very strong resistance area between $14 and $18, with the 61% Fibonacci level from top to bottom at $16.60

Cosmos (ATOM): Waiting For Break of 200EMA | BULLISH AFATOM is pressing against the 200EMA, which has been acting as dynamic resistance for a while. A clean break above this level would be the confirmation we’re waiting for to target higher zones.
The structure remains intact above the support zone, and as long as buyers defend this level, we’re positioned for a move towards $10.70 first, and eventually $15.00 as the larger target.
Right now, it’s all about that EMA break — that’s the trigger for momentum to shift properly in favor of the buyers.
Swallow Academy
ATOM USDTATOM USDT
SPOT
On the daily timeframe, after breaking above the green box, this altcoin has the potential to move toward the resistance levels highlighted by the red lines.
Personally, I’ve entered a small long position on this altcoin while strictly applying risk management.
ATOM Sleeping GIANT ALT | Moving Averages BULLISH like NOV24'ATOM is slowly but surely making a turn up towards the first Take Profit point.
From the bottom, Cosmos has already increased a whopping 52% , with even more room to grow:
In my previous update, the 4 was still bearish when looking at trend lines and moving averages.
However, this has flipped to bullish from the 4h upward, with the price trading high above the moving averages in the 4h and in the daily timeframe:
4H:
Daily:
Note how previously, the big increases started as soon as the price regained the moving averages as support.
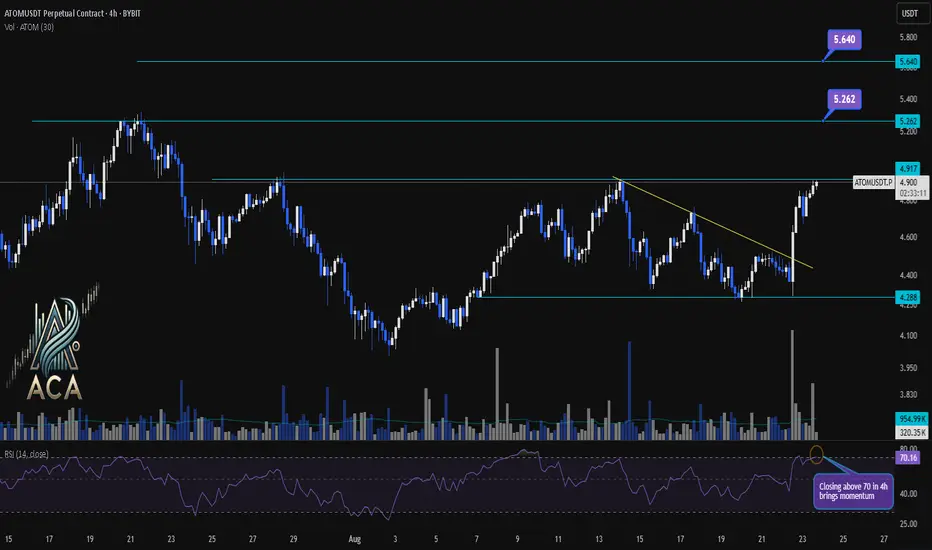
ATOMUSDT 4H Chart Analysis | Momentum Breakout in PlayATOMUSDT 4H Chart Analysis | Momentum Breakout in Play
🔍 Let’s dive into the ATOM/USDT perpetual contract and analyze the latest price action, outlining key bullish setups and momentum signals.
⏳ 4-Hour Overview
The 4-hour chart reveals a strong bullish push, with price surging above the trendline resistance and reclaiming the local $4.917 zone. Volume has notably increased, confirming the move’s strength. Meanwhile, the RSI indicator is closing above 70, marking the overbought territory and highlighting a surge in buyer momentum.
🔺 Long Setup:
On the upside, sustained momentum could ignite a rally toward $5.262 first, with a further target at $5.640 should follow-through buying persist. These levels line up with previous resistance zones and potential trend-based extensions.
📊 Key Highlights:
- 4H breakout confirms bullish bias and momentum shift.
- Volume spike adds conviction to the move.
- RSI closing above 70 signals strong momentum; a continuation could bring further upside.
- Short-term resistance targets are $5.262 and $5.640.
- “Closing above 70 in 4h brings momentum” — if sustained, might hint at a new trend leg.
🚨 Conclusion:
ATOM/USDT is showcasing renewed bullish momentum. Watch for confirmations above resistance and be mindful of short-term exhaustion signals in the overbought zone. If momentum holds, upside targets at $5.262 and $5.640 are in play.
Cosmos (ATOM): Looking For Break of Structure | Bullish AFOne of the most undervalued coins, ATOM, might be going for a decent BOS, which could open for us a smaller scalping opportunity. On a bigger timeframe, this coin is still a sleeper!
More in-depth info is in the video—enjoy!
Swallow Academy

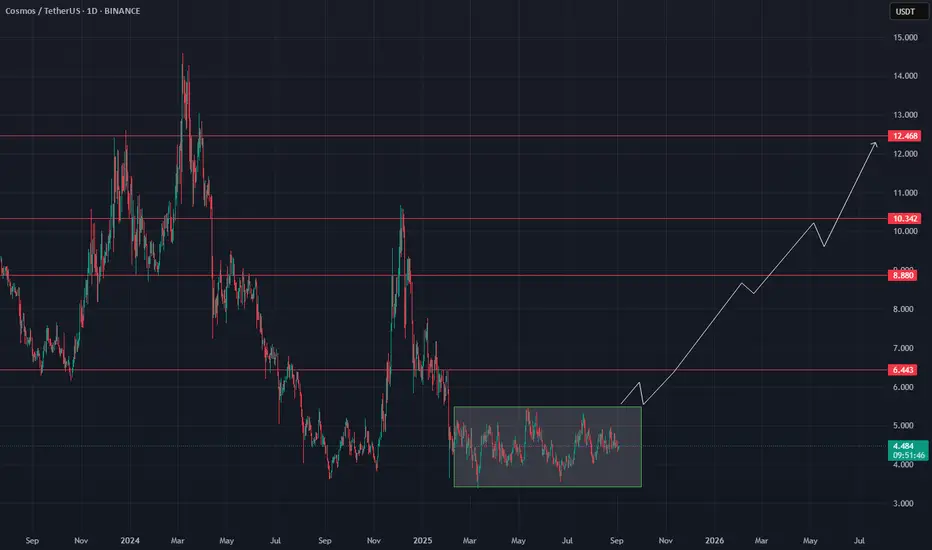
ATOM/USDT Weekly – Strong Accumulation, Is a Major Reversal?📊 Overview
The ATOM/USDT weekly chart shows that the price is currently in a long-term accumulation phase after a massive downtrend since 2022.
The 3.5–4.6 USDT demand zone has acted as a strong historical support level since 2020 and has once again proven its strength during 2024–2025.
In simple terms, this area is the “last defense” zone for buyers and could determine whether ATOM will start a new bullish cycle or face a deeper breakdown.
---
🔹 Structure & Pattern Analysis
Macro Pattern: ATOM has formed a wide sideways/base structure near the multi-year demand, signaling potential accumulation by smart money.
Key resistance (short-term): 5.375 – 6.00 USDT, the first gate to confirm a bullish reversal.
Further resistances: 6.80 → 9.96 → 14.46 (strong mid-cycle supply).
If broken: The path opens toward 21.81 – 32.27 USDT, aligning with higher timeframe resistances.
---
✅ Bullish Scenario
1. Price continues to hold above the 3.5–4.6 demand zone, showing strong buyer presence.
2. A confirmed breakout above 5.375 with volume could shift market structure into a new Higher High (HH) formation.
3. Bullish targets:
6.00 → 6.80 (first resistance levels)
9.96 → 14.46 (major supply zone)
Extended targets: 21.81 – 32.27 USDT
📌 Bullish confirmation: A solid weekly close above 6.00 USDT.
---
❌ Bearish Scenario
1. Rejection from 5.3–6.0 resistance may drag price back toward the middle of the current range.
2. A decisive weekly close below 3.50 would invalidate the accumulation structure and open downside continuation:
2.70 → 2.10
Possible extension: 1.65 – 1.30 USDT (historical supports).
📌 Bearish confirmation: Consistent weekly closes below 3.50 USDT.
---
🎯 Conclusion
The 3.5–4.6 zone remains the ultimate pivot: hold = bullish potential, breakdown = deeper downside.
5.375–6.00 acts as the breakout trigger zone: clearing this level may spark a major reversal trend.
Currently, ATOM is in a long-term accumulation range, waiting for a decisive breakout.
#ATOM #Cosmos #ATOMUSDT #CryptoAnalysis #PriceAction #SupportResistance #SwingTrade #WeeklyChart
ATOM_USDT 4H Sell Trade.Atom is reaching to the 4H supply right now. When I added Fibonacci Indicator on the chart I can see Golden Pocket zone on that area. This is a good sing for Market revasal.Other wise Im expecting 15munutes divergence could be created. So keep watching on the Market to catch a good trade.
HAPPY TRADING 🎉
buy midterm atom "🌟 Welcome to Golden Candle! 🌟
We're a team of 📈 passionate traders 📉 who love sharing our 🔍 technical analysis insights 🔎 with the TradingView community. 🌎
Our goal is to provide 💡 valuable perspectives 💡 on market trends and patterns, but 🚫 please note that our analyses are not intended as buy or sell recommendations. 🚫
Instead, they reflect our own 💭 personal attitudes and thoughts. 💭
Follow along and 📚 learn 📚 from our analyses! 📊💡"
Cosmos (ATOM): Seeing Potential 8% Movement Towards FVGAfter a successful H&S pattern, we are seeing a good opportunity to take a few long positions here on the ATOM coin, so that's what we are looking for: a potential 8% movement to happen here!
More in-depth info is in the video—enjoy!
Swallow Academy

Cosmos 365 · Proof of Bullish · Bull Market Wave NextCosmos (ATOMUSDT) has been sideways for an entire year now. The current trading range is a long-term support, buy and accumulation zone. This zone is already proven to be a bullish launchpad based on late 2024. The same levels were active in August-October-November 2024 leading to a mild bullish wave. This is only the start.
The same support range is activated again in Febraury-March-April-May-June-July-August 2025 and this will lead to a major bullish wave. Notice that the first period of consolidation lasted only three months and thus we had a mild wave only. With now six full months of consolidation the next bullish wave will be at least twice as big. But the market and how participants act and react doesn't work linearly. A six months consolidation period can lead to a bullish wave that is 3-5 times stronger than the previous one.
What you are seeing right now is actually pretty good. ATOMUSDT is red, yes. Notice weeks of bearish action yet no new lows, no significant challenge of support. More sideways which is as bullish as it gets. We already saw many examples of a downtrend and how the market goes lower and lower always producing new lows. This scenario is far from being what is present on the chart.
ATOM has been dropping for weeks but its price isn't affected that much negatively because this is only a minor retrace. An intermediary pause. The positive side of this type of market behavior is how it tends to unravel. It goes from quiet and shy to fast, surprising and unexpected. The market can change any day.
You can start seeing bullish action tomorrow just as it can start next week or the week above. The retrace has been going long enough and it lacks volume and momentum, sellers are running dry; when momentum dies down, the market turns.
Look at Bitcoin, it isn't dropping anymore. It stopped at the previous high and so far this is a strong support. Even if it moves lower, we continue bullish above $100K long-term. It is normal for a small pause before additional growth. $15 is an easy target, ATOM can grow much more in the coming months. Late 2025-early 2026 are the best dates for higher prices. Buy now and hold.
Namaste.

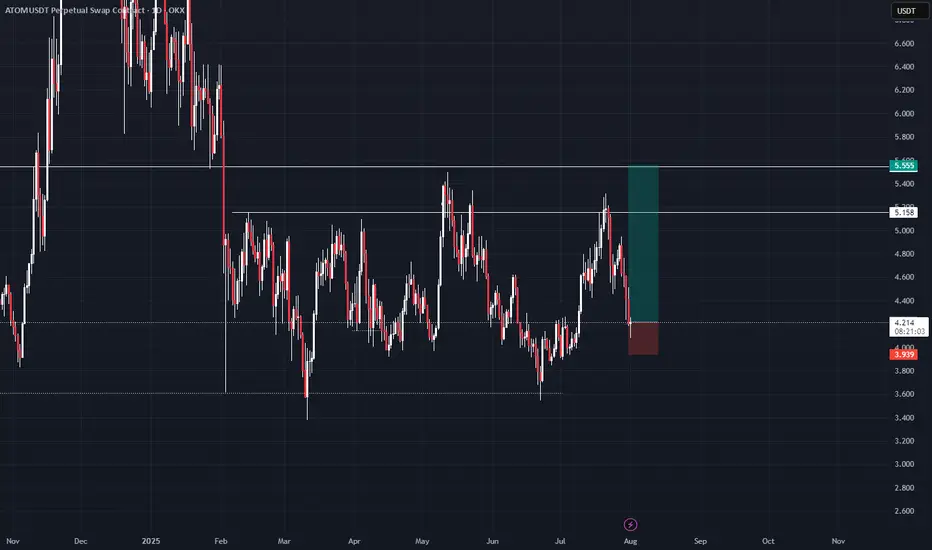
ATOMim thinking about that as a diviation from global diapozone so we have to at least test its lower boarder 5.555 that is my first target if we will return higher than 5.555 ill be looking for 11.4 as a swing target