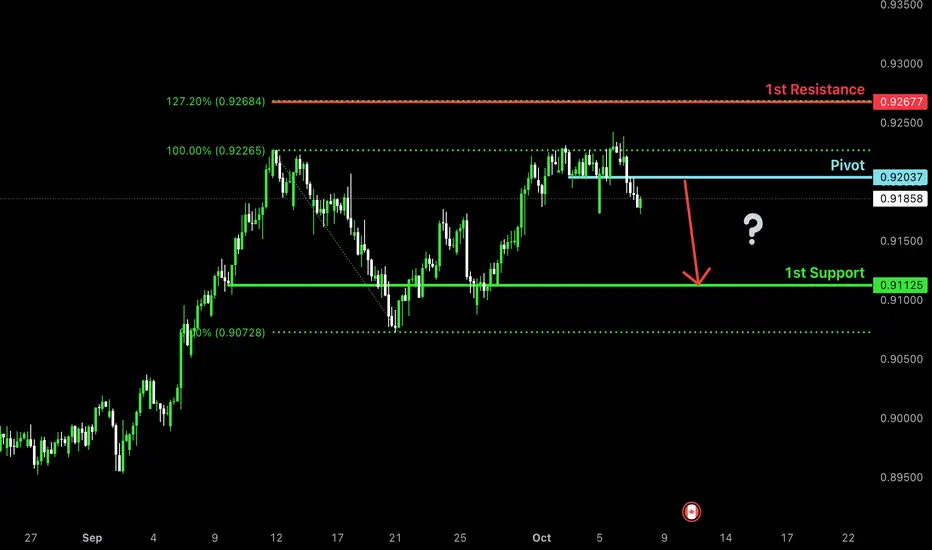
Potential bearish drop?AUD/CAD is rising towards the pivot which is a pullback resistance and could drop to the 1st support.
Pivot: 0.92037
1st Support: 0.91125
1st Resistance: 0.92677
Disclaimer:
The above opinions given constitute general market commentary, and do not constitute the opinion or advice of IC Markets or any form of personal or investment advice.
Any opinions, news, research, analyses, prices, other information, or links to third-party sites contained on this website are provided on an "as-is" basis, are intended only to be informative, is not an advice nor a recommendation, nor research, or a record of our trading prices, or an offer of, or solicitation for a transaction in any financial instrument and thus should not be treated as such. The information provided does not involve any specific investment objectives, financial situation and needs of any specific person who may receive it. Please be aware, that past performance is not a reliable indicator of future performance and/or results. Past Performance or Forward-looking scenarios based upon the reasonable beliefs of the third-party provider are not a guarantee of future performance. Actual results may differ materially from those anticipated in forward-looking or past performance statements. IC Markets makes no representation or warranty and assumes no liability as to the accuracy or completeness of the information provided, nor any loss arising from any investment based on a recommendation, forecast or any information supplied by any third-party.
Trade ideas
AUDCAD LONG 10.7.2025Trend : bullish
divergence : n/a
continuation : HH & HL
reversal : n/a
sentiments according to marketmilk
AUD : bullish
CAD : bearish

Market Insights with Gary Thomson: 6 - 10 OctoberMarket Insights with Gary Thomson: FOMC Minutes & Powell’s Speech, Canada Jobs, RBNZ Rate Decision
In this video, we’ll explore the key economic events and market trends, shaping the financial landscape. Get ready for expert insights into financial markets to help you navigate the week ahead. Let’s dive in!
In this episode of Market Insights, Gary Thomson unpacks the strategic implications of the week’s most critical events driving global markets.
👉 Key topics covered in this episode:
— FOMC Minutes and Fed Powell’s Comments
— Canada’s Unemployment Rate
— RBNZ Interest Rate Decision
Gain insights to strengthen your trading knowledge.
This video represents the opinion of the Companies operating under the FXOpen brand only. It is not to be construed as an offer, solicitation, or recommendation with respect to products and services provided by the Companies operating under the FXOpen brand, nor is it to be considered financial advice.


AUDCAD | BullishHTF: Price showing clear bullish intent, breaking significant highs and maintaining structure to the upside.
MTF: Currently seeking sell-side liquidity to be taken before the next leg. Once that liquidity sweep completes and internal structure is mitigated, attention shifts to lower timeframes for refined confirmations and entries.
Until then, patience — this is my money lead direction. 🧭

AUD/CAD: Bearish Drop to 0.91630?FX:AUDCAD is signaling a bearish move on the 1-hour chart , with an entry zone between 0.92215-0.92280 near a resistance level.
First target at 0.91875 🎯 marks initial support, while the second at 0.91630 🎯 offers a deeper downside play. 📈 Set a stop loss on a daily close above 0.9232 to manage risk effectively. 🌟
A break below 0.92 with strong volume could confirm this drop, driven by CAD strength and AUD weakness. Watch commodity trends! 💡
📝 Trade Plan:
✅ Entry Zone: 0.92215 – 0.92280 (resistance area)
❌ Stop Loss: Daily close above 0.9232 to manage risk
🎯 Target 1: 0.91875 (initial support)
🎯 Target 2: 0.91630 (deeper downside target)
Ready for this move? Drop your take below! 👇

AUD/CAD BEARS ARE GAINING STRENGTH|SHORT
AUD/CAD SIGNAL
Trade Direction: short
Entry Level: 0.921
Target Level: 0.910
Stop Loss: 0.928
RISK PROFILE
Risk level: medium
Suggested risk: 1%
Timeframe: 1D
Disclosure: I am part of Trade Nation's Influencer program and receive a monthly fee for using their TradingView charts in my analysis.
✅LIKE AND COMMENT MY IDEAS✅

AUDCAD: DTL BreakoutDaily Timeframe:
Bullish bar on market open indicates strength
Bullish bar also covering dojis on two previous days
H1 Timeframe:
Price crosses above DTL as first indication of momentum
Price is above crossing above EMA20
EMA20 is also expanding away from EMA60
Price crossing back above EMA60 indicates bearish sentiment is unlikely to hold

AUD/CAD Daily AnalysisPrice is potentially printing a double top at the 0.9220 price point.
With daily resistance found there in September of this year and again at the beginning of October, there could be opportunities to sell.
Look for a trade setup that meets your strategy rules.


Potential pullback for AUDCAD?Hello traders! We are taking a look at this market for a potential pullback towards support around the 0.91600 area. According to Reuters, the Canadian dollar is showing signs of strengthening due to the impact of the decade bond and so we are looking for short opportunities in this market. The market is currently hovering around September’s high and we could see rejections from this level and a possible bearish move towards 50% of last week’s low on Thursday. Looking for a daily closure below 0.91950 to set up short positions in our sell zone if price revisits the area and will be targeting 0.91630. We will continue to looking for other confirmations to support this idea.

Bullish bounce?AUD/CAD is falling towards the support level, which is a pullback support that aligns with the 38.2% Fibonacci retracement and could bounce from this level to our take rpofit.
Entry: 0.91661
Why we like it:
There is a pullback support that lines up with the 38.2% Fibonacci retracement.
Stop loss: 0.91036
Why we like it:
There is a pullback support that lines up with the 78.6% Fibonacci retracement.
Take profit: 0.92722
Why we like it:
There is a resistance level which lines up with the 127.2% Fibonacci extension.
Enjoying your TradingView experience? Review us!
Please be advised that the information presented on TradingView is provided to Vantage (‘Vantage Global Limited’, ‘we’) by a third-party provider (‘Everest Fortune Group’). Please be reminded that you are solely responsible for the trading decisions on your account. There is a very high degree of risk involved in trading. Any information and/or content is intended entirely for research, educational and informational purposes only and does not constitute investment or consultation advice or investment strategy. The information is not tailored to the investment needs of any specific person and therefore does not involve a consideration of any of the investment objectives, financial situation or needs of any viewer that may receive it. Kindly also note that past performance is not a reliable indicator of future results. Actual results may differ materially from those anticipated in forward-looking or past performance statements. We assume no liability as to the accuracy or completeness of any of the information and/or content provided herein and the Company cannot be held responsible for any omission, mistake nor for any loss or damage including without limitation to any loss of profit which may arise from reliance on any information supplied by Everest Fortune Group.

AUDCAD: Long Trading Opportunity
AUDCAD
- Classic bullish formation
- Our team expects growth
SUGGESTED TRADE:
Swing Trade
Buy AUDCAD
Entry Level - 0.9206
Sl - 0.9200
Tp - 0.9217
Our Risk - 1%
Start protection of your profits from lower levels
Disclosure: I am part of Trade Nation's Influencer program and receive a monthly fee for using their TradingView charts in my analysis.
❤️ Please, support our work with like & comment! ❤️

AUDUSD - Buy Setup Hello all as per my small analysis here is a buy setup with good risk to reward ratio.

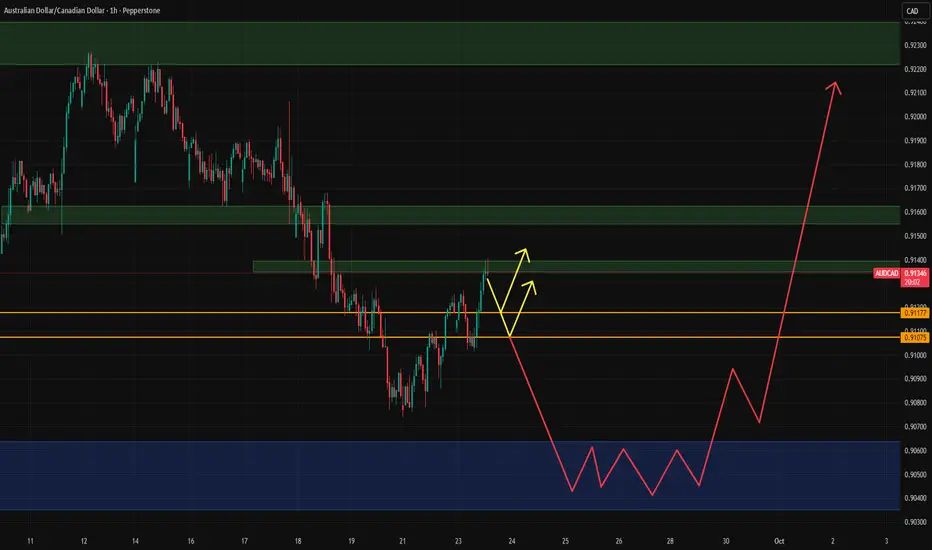
Bullish set up AUDCADI'm leaning bullish towards this pair. On a technical level we can see an uptrend after an accumulation on the daily TF.
Looking closer on the 1H we can see higher lows and higher highs setting in. Rn price is entering a supply zone and I expect price to react to this or the next one above. I want to see another 1H retracement to 1 of the 2 OB's I marked out in orange.
This is the area I want to be placing a long position in after bullish confirmation on the lower TF.
I expect price to come back at least to the 0,92000 area, but my aim is 0,93500. This is close to the last weekly high.
The only thing that worries me, is that price made a retest after the accumulation, but didn't tap into the demand zone.
According to the fundamentals, we can expect bullishness because Canada has been getting bad economic data regarding GDP and unemployment. House prices are going down, what can lead to a lower demand for this currency.
On the other hand, Australia has a lower unemployment number and the central bank remains more hawkish, aiming on modest growth. Overall they received good economic data.

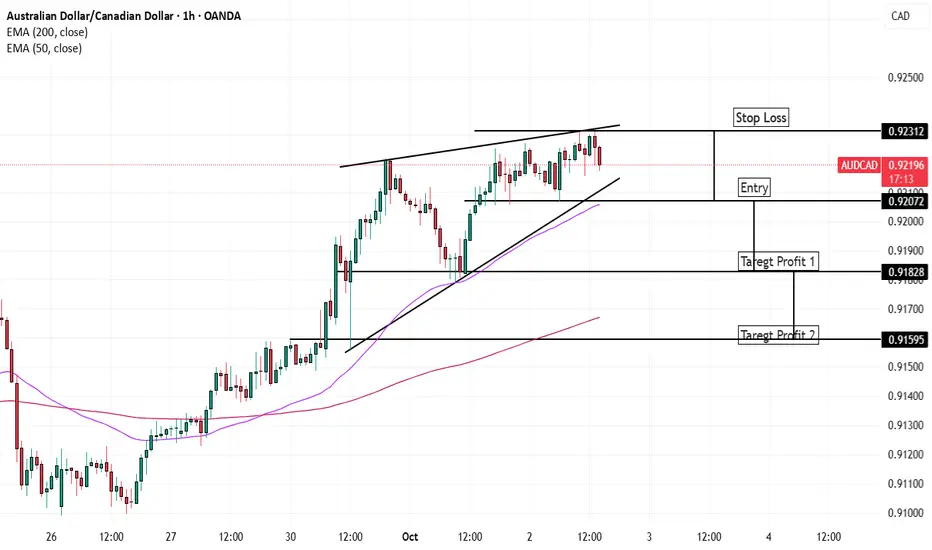
AUDCAD 1HTF Rising Wedge SetupPrice is moving inside a Rising Wedge, typically a bearish reversal signal.
Watching for a break below wedge support to confirm downside.
Potential targets: next support zones as marked on chart.
Invalidation: Break and close above wedge resistance.
#AUDCAD #Forex #ChartPattern #Wedge

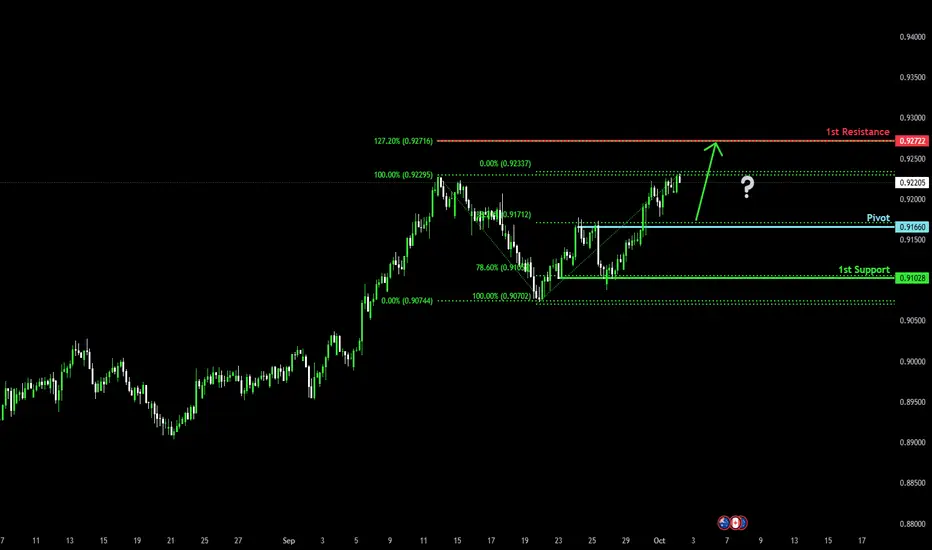
Bullish bounce setup?AUD/CAD is falling towards the pivot which is a pullback support and could bounce to the 1st resistance which lines up with the 127.2% Fibonacci extension.
Pivot: 0.9166
1st Support: 0.91028
1st Resistance: 0.92722
Disclaimer:
The above opinions given constitute general market commentary, and do not constitute the opinion or advice of IC Markets or any form of personal or investment advice.
Any opinions, news, research, analyses, prices, other information, or links to third-party sites contained on this website are provided on an "as-is" basis, are intended only to be informative, is not an advice nor a recommendation, nor research, or a record of our trading prices, or an offer of, or solicitation for a transaction in any financial instrument and thus should not be treated as such. The information provided does not involve any specific investment objectives, financial situation and needs of any specific person who may receive it. Please be aware, that past performance is not a reliable indicator of future performance and/or results. Past Performance or Forward-looking scenarios based upon the reasonable beliefs of the third-party provider are not a guarantee of future performance. Actual results may differ materially from those anticipated in forward-looking or past performance statements. IC Markets makes no representation or warranty and assumes no liability as to the accuracy or completeness of the information provided, nor any loss arising from any investment based on a recommendation, forecast or any information supplied by any third-party.

AUD/CAD: Rejection from Resistance Signals Bearish CorrectionAUD/CAD has faced a strong rejection near the 0.9218 resistance zone, with price now turning lower after a failed breakout attempt. Although the move was initially supported by the upward trendline, momentum faded near the highs, indicating buyer exhaustion.
If sellers maintain control below 0.9200, the pair is likely to move toward the 0.9160 support level, with further downside potential toward 0.9132. The broader structure points to a corrective phase within the channel, reinforcing a bearish near-term bias.

AUDCAD: Important Breakout Confirmed 🇦🇺🇨🇦
AUDCAD completed a correctional movement within a bullish flag pattern.
A confirmed violation of its resistance line with a daily candle close above that
suggests a highly probable bullish continuation.
The next strong resistance is 0.925.
It will be the next goal for the buyers.
❤️Please, support my work with like, thank you!❤️
I am part of Trade Nation's Influencer program and receive a monthly fee for using their TradingView charts in my analysis.

Lingrid | AUDCAD Resistance Rejection Short OpportunityFX:AUDCAD faced a strong rejection from the resistance area at 0.9218 and is now turning lower. Price action shows that after a breakout run supported by the upward trendline, momentum failed near the highs, signaling exhaustion. If sellers maintain control below 0.9200, the market is likely to test the 0.9160 level, with potential extension toward 0.9132. The broader structure suggests a corrective phase inside the channel, aligning with bearish bias.
⚠️ Risks:
A recovery above 0.9218 could invalidate the bearish outlook.
Strong AUD performance from macro data might lift the pair again.
Global risk-on sentiment could dampen CAD demand and push price back higher.
If this idea resonates with you or you have your own opinion, traders, hit the comments. I’m excited to read your thoughts!
