Trade ideas
TradeCityPro | AVAX: Downtrend Persists Near Key Support👋 Welcome to TradeCity Pro!
In this analysis, I want to review the AVAX coin. One of the older crypto projects active in RWA, it has a market cap of $8.48 billion, ranking 18th on CoinMarketCap.
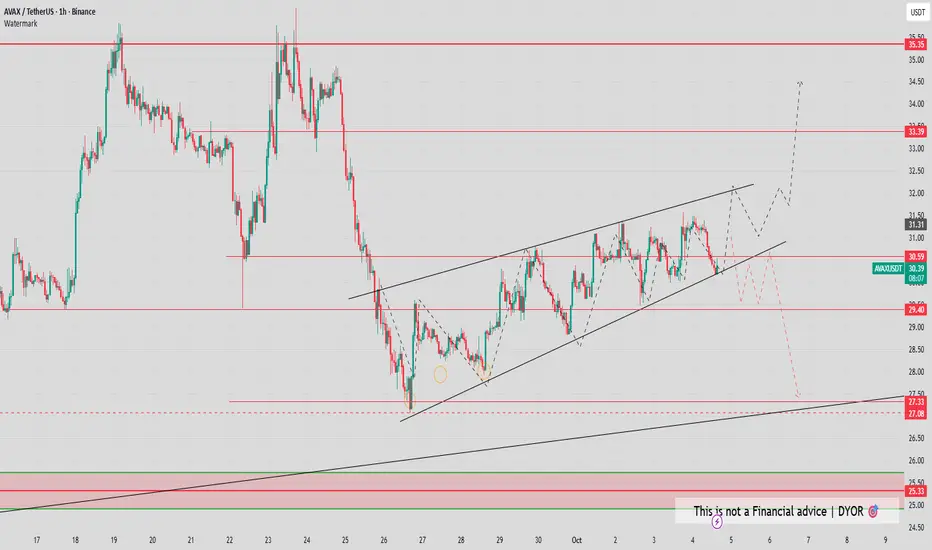
⏳ 1-Hour Timeframe
On the 1-hour chart, we see a downtrend in this coin, which has continued after last week’s decline.
✨ After the 23.06 level was faked, bearish momentum entered the market, and a new downwave began. After breaking the 20.68 support, the price dropped to 19.10 and is now in a correction and pullback phase.
📊 Volume has significantly decreased during this correction, indicating the strength of the downtrend. Although today is Saturday and the overall market volume is low, if the price moves back toward 19.10 with increasing volume, we can confirm the volume for the bearish trend.
💥 The RSI oscillator is correcting alongside the price and, after exiting Oversold, is currently around 50.
⭐ If the 50 level breaks, it signals that bearish momentum in the market has decreased, and AVAX could enter a range-bound or corrective structure.
✔️ On the other hand, if selling volume returns and RSI moves toward 30, breaking this level would bring bearish momentum back into the market. In this case, breaking the 19.10 trigger allows us to open a short position.
🔍 For now, there are better coins for long positions that have recovered more. On AVAX, as long as it stays below 20.68, long positions don’t make much sense.
📝 Final Thoughts
Stay calm, trade wisely, and let's capture the market's best opportunities!
This analysis reflects our opinions and is not financial advice.
Share your thoughts in the comments, and don’t forget to share this analysis with your friends! ❤️

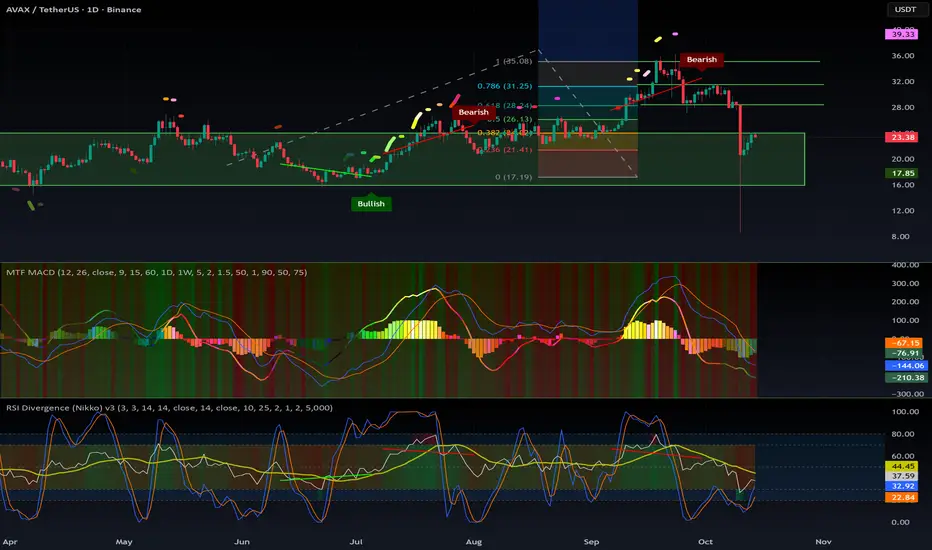
$AVAX: time to refill our bags!CRYPTOCAP:AVAX remains a solid project that’s not going anywhere. It’s now evolving into a game-oriented blockchain, which adds an interesting new use case to what was once a fairly mature ecosystem.
The current price range of $22–$23 sits in a strong demand zone, a level that has historically triggered major pumps.
With the Multi Timeframe MACD deeply oversold, the RSI low, and the Stochastic RSI bottomed out on the 1D, this looks like an excellent opportunity to build a position with a favorable risk/reward ratio.
It may take some time to fully clear the bearish divergence from the last rally, but the October 11th crash likely reset the structure — suggesting a bullish outlook moving forward.
Fibonacci targets:
🎯 TP1: $28.5
🎯 TP2: $31.4
🎯 TP3: $35.08
If the market enters a true altseason, CRYPTOCAP:AVAX could climb significantly higher — but for now, these are the most reasonable targets.
As always, DYOR before entering any trade.
#AVAX #CryptoAnalysis #Altcoins #TechnicalAnalysis #RSI #MACD #StochasticRSI #TradingSetup #Bullish #GameFi #Altseason #DYOR
#AVAXUSDT Daily Chart
Price has done a liquidity sweep and is currently climbing back up. MACD is now showing some bearish weakness, RSI is sold and EMAs are preparing to turn bearish. Price is now expected to keep pushing up aiming to retest the 100MA and the 200MA as a short-term target.

AVAX Very good position for avax.
Fibonacci is showing an interesting position on daily time frame, we are in the golden zone, so if market will keep this quiet trend after the last week storm i think that this token will hit 28-32$ this week.
please be cautious when trading futures.
nfa
dyor

AVAX Ignites Bias: Long
Timeframe: 15-min (scalp to intraday swing)
Not a financial advice. Just sharing my personal setup and observations.
Always DYOR, manage your risk, and trade safe.

TradeCityPro | AVAXUSDT Further Decline or Time to Rise?👋 Welcome to TradeCityPro Channel!
✨ Let’s move on to Avalanche (AVAX) one of the older coins in the market, mostly active in the DeFi ecosystem with its own network and solid utility. It’s often considered a bull-run project due to its long-term relevance and use cases.
🌐 Overview of Bitcoin
Before we begin, let me remind you that we’ve moved the Bitcoin analysis section to a separate daily report at your request,
so we can go into more detail about Bitcoin’s condition, price action, and dominance:
🕧 In the 4-hour timeframe, after the recent market crash, AVAX is trying to build a new structure and stabilize its price action.
🟢 Long Setup:
It’s still too early to go long, but AVAX has shown a partial recovery compared to other coins, and its drop hasn’t been as deep.
For a long position, we should either range here for a while and enter after a confirmed breakout above 23.04,
Or wait for a higher high and higher low formation to confirm a bullish structure before entering.
🔴 Short Setup:
The short scenario is clear if 20.57 breaks with volume, it would signal bearish continuation, and opening a short position would be reasonable.
📝 Final Thoughts
Stay calm, trade wisely, and let's capture the market's best opportunities!
This analysis reflects our opinions and is not financial advice.
Share your thoughts in the comments, and don’t forget to share this analysis with your friends! ❤️
AvaxFull Edge in Simple Terms
Buy dips toward your “This Price” (20.5–21.0 zone).
Target 23.0–23.8 (first the trendline/confluence, then above for squeeze into liquidation cluster).
However you can Take your profit bit by Bit on this levels as wel
21.3
21.6
22
22.6
23
stop
19.5

AVAX on the verge of a huge moveThere s have been some FUD on Avax this last week. Just wait after Octobers the 20 and you will desiere to bought more. A great run is waiting on this coin.
Avax un $ 30 its for free
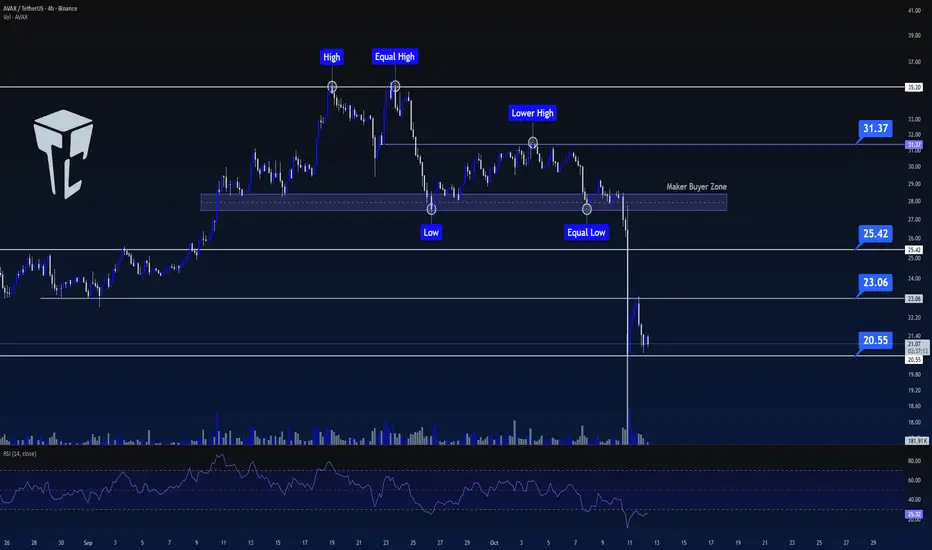
TradeCityPro | AVAX: Testing Key Support and Resistance Zones👋 Welcome to TradeCity Pro!
In this analysis, I will review AVAX, one of the Layer 1 and RWA coins with a market cap of $11.98 billion, ranked 16th on CoinMarketCap.
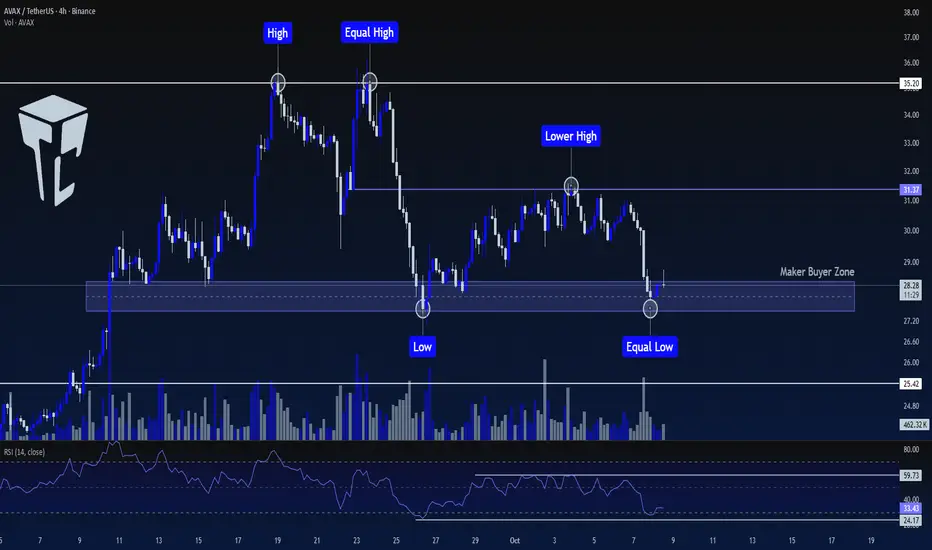
⏳ 4-Hour Timeframe
On the 4-hour timeframe, AVAX has a strong Maker Buyer zone that has been tested multiple times and provided support.
⭐ On the other hand, after creating two equal peaks at 35.20, the next peak was lower, at 31.37.
✅ This indicates that the sellers' strength in the market is greater than the buyers' strength, but buyers also have a significant support level, which has been effective so far in preventing further price decline.
🧩 Since Bitcoin's trend is entirely bullish, and there’s a high chance of Bitcoin's dominance decreasing, altcoins may experience an upward move. So, I am inclined to open a long position on this coin.
📊 The first trigger for a long position is the break of 31.37. The main trigger to start the coin's primary trend will be 35.20.
💥 If you believe the market will move downward and are looking for a short position, breaking the support level I marked could lead to a price decline towards 25.42.
📝 Final Thoughts
Stay calm, trade wisely, and let's capture the market's best opportunities!
This analysis reflects our opinions and is not financial advice.
Share your thoughts in the comments, and don’t forget to share this analysis with your friends! ❤️
AVAX – Retest in Progress Before the Next Push UpAfter breaking the key resistance zone at $26.60, AVAX surged strongly, reaching a high of $36.60 in one decisive leg up.
Now, the price is pulling back to confirm the breakout, approaching the previous resistance, which could now act as support.
This area represents a confluence zone, aligning with the rising trendline from June, and may serve as a strong accumulation level for bulls preparing for the next upward leg.
From a risk/reward perspective, this setup is also attractive, offering an estimated 1:4 ratio — a solid structure for a technical long entry.
I’m looking to buy around this zone, with expectations for a continuation toward new highs once confirmation appears. 🚀
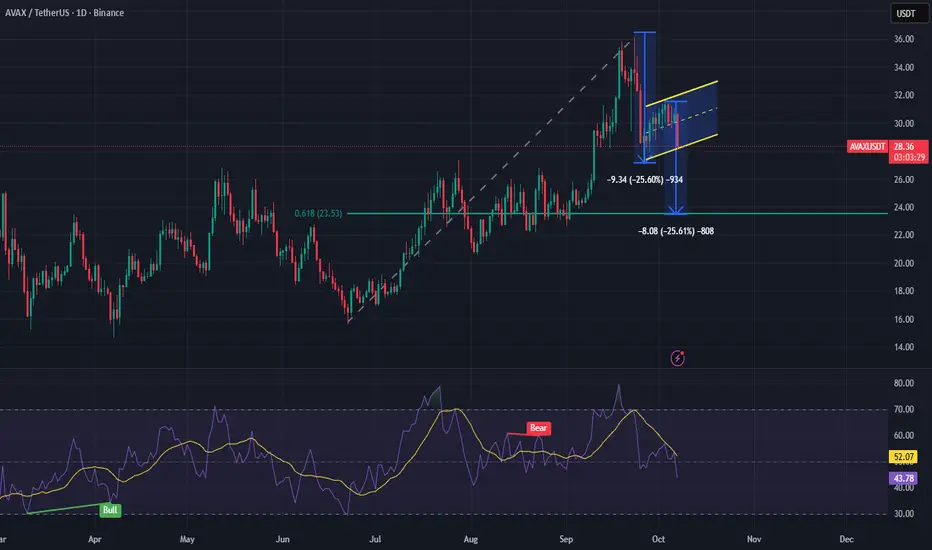
AVAX - Bear Flag/ABCD PatternFollowing the formation of a double top on 23 Sep 2025, AVAX has entered a downward trend, currently exhibiting characteristics of a bear flag consolidation. Within this structure, an ABCD harmonic pattern appears to be developing, suggesting potential continuation of bearish momentum.
Should both the bear flag and ABCD pattern play out, the projected price target lies in the range of $23.50–$23.60. This zone aligns with the 61.8% Fibonacci retracement level, derived from the swing low on 22 Jun 2025 to the swing high on 23 Sep 2025.
Avalanche (AVAX): New Week New Gameplan | Looking For BreakoutLast time buyers failed to break through the current resistance zone, so now we adjust the game plan for AVAX. Price is currently holding above EMAs, but before confirming continuation, we want to see the reclaim of the middle line of the Bollinger Bands, followed by a clean break of the local high.
Only after that, we’ll look for a confirmational BOS on smaller timeframes — that’s when continuation toward the next target becomes more likely.
Swallow Academy

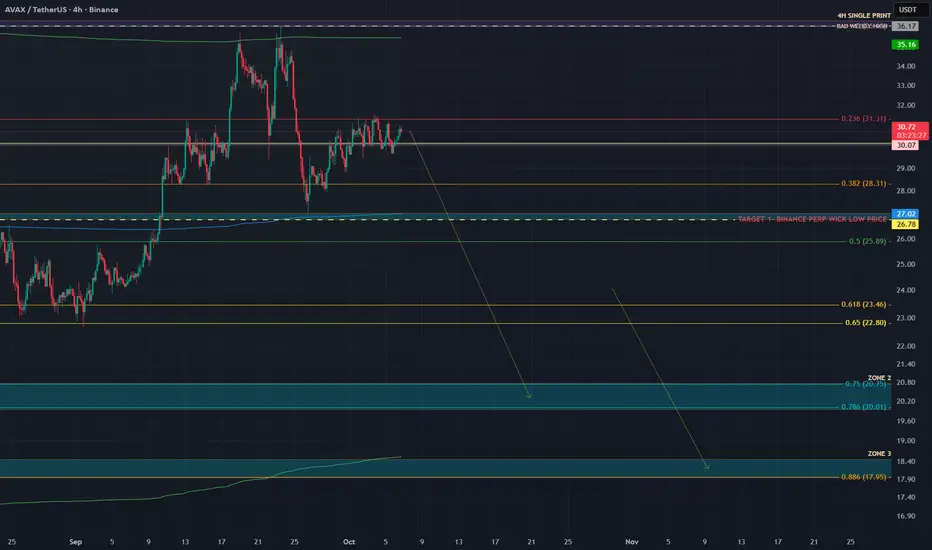
AVAX | ANOTHER DUMP IS LOADING | CHOO CHOOOOCRYPTOCAP:AVAX looks ready for another potential dump. In my CRYPTOCAP:AVAX analysis of August 26 we nailed the entry and exit pixel perfect.
The CRYPTOCAP:AVAX analysis of September 11 was also on point.
I believe that we're not setting up for another hard leg down. Lets look at the data to validate our thesis.
We’re currently in a textbook compression before expansion phase. Price has been moving sideways for days.
CVD Spot is trending down while price holds flat.
CVD Stablecoin-Margined Contracts is also trending down.
CVD Coin-Margined Contracts is trending down even more aggressively.
This tells us that while price is stable, market participants are hitting the bid — selling through the order book. The only reason price hasn’t dropped yet is because passive buyers (limit bids) are absorbing that selling pressure. Once that liquidity weakens or gets pulled, price can easily air pocket lower.
Now, here’s where it gets interesting.
Open Interest (Stablecoin-Margined) is flat.
Open Interest (Coin-Margined) is rising steadily.
At the same time, Coin-Margined CVD continues to drop, and price remains flat inside the range.
Conceptually, this combination is very bearish. Rising OI means new positions are being opened. Falling CVD means those positions are being opened via market sells — in other words, traders are adding shorts. The steady rise in coin-margined OI tells us these are leveraged positions taken directly against the asset, not just speculative stablecoin longs.
This pattern shows that new short exposure is building quietly under the surface, while spot and stablecoin flows fail to show any real buying. It’s the kind of distribution that looks like “accumulation” on the chart — but it’s actually leveraged sellers being absorbed by patient buyers. When those buyers step away, the imbalance resolves sharply to the downside.
In plain English:
Price is holding up because someone keeps catching the falling knife. But the knife is still falling.
Unless Spot CVD turns positive and stablecoin OI starts rising with it (showing real demand returning), this setup points to one thing — another leg down is coming for AVAX.
I'm targeting ZONE 2 and ZONE 3. Check the Order Flow Data here: ibb.co
Trade safe, Nomads!
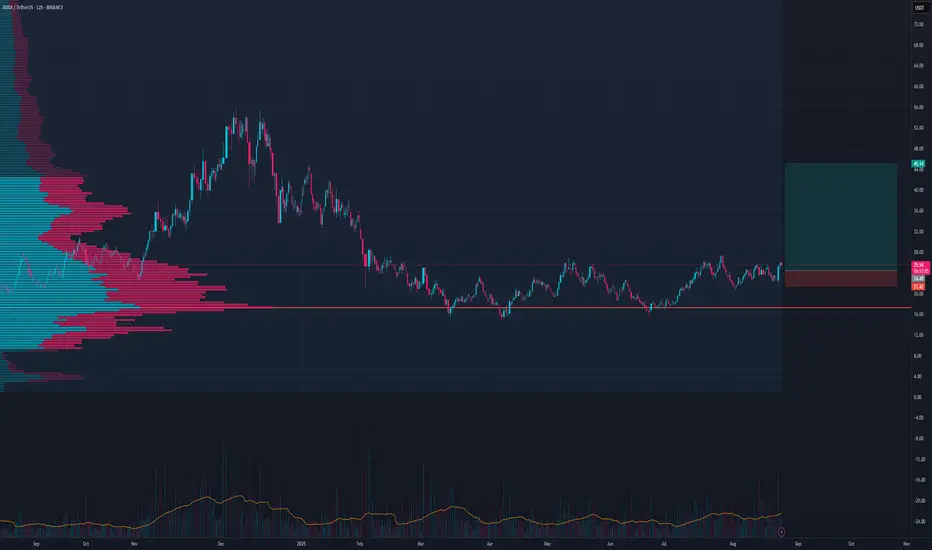
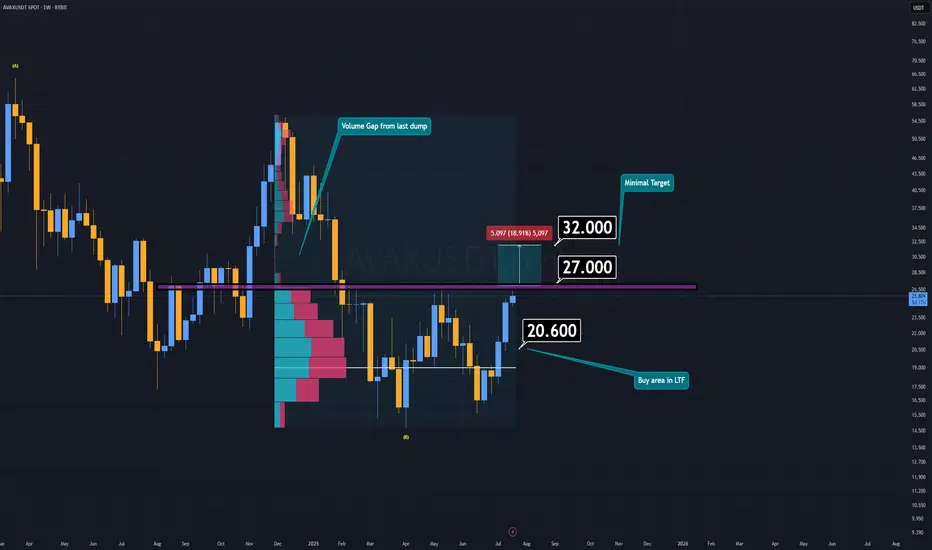
AVAX Analysis (1W)AVAX is currently attempting to form a double bottom pattern, which could signal a strong bullish reversal if confirmed. Earlier this week, AVAX made an effort to break down the key support/resistance zone, but it lacked the necessary volume to succeed.
If AVAX manages to reclaim the resistance area around $27 or higher, and confirms the breakout with a daily candle retest, the minimum target sits at $32.
However, if AVAX fails to break through resistance, there’s potentially an even better buying opportunity in the lower timeframes—a demand zone between $20 and $20.6.
I believe altcoins will offer another chance to catch up while prices are still far below their future valuations.
-S Wishes you the best in luck.
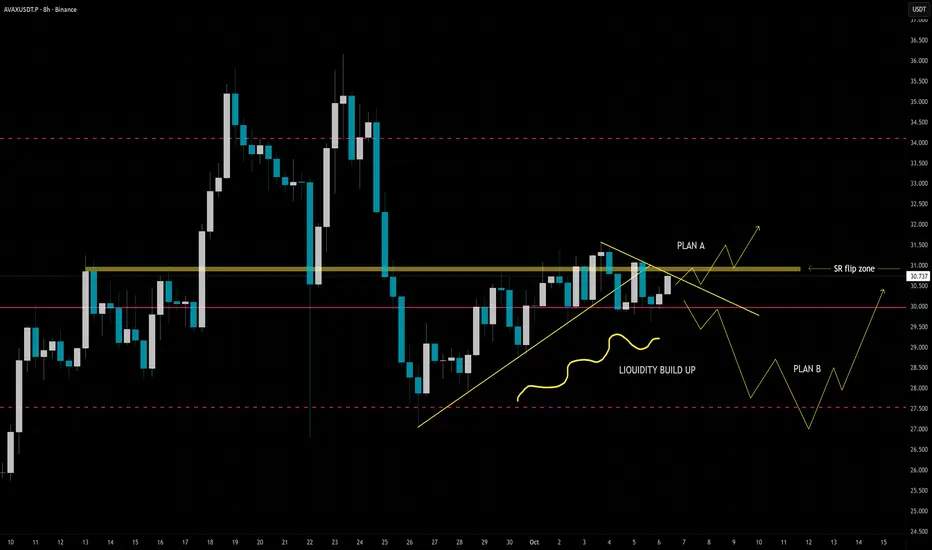
AVAX 8HCRYPTOCAP:AVAX 8H. Plan A please, thank you, por favor.
We broke below trendline, made fakeout upwards and back down again. In case we don't reclaim support of yellow SR flip zone and break down pink POC level there is a higher chance for Plan B to get in action some level.
Plan B. Pink dotted line = VAL = Value Area Low areas is the extreme around 10% drop. I don't expect price to go that low but check out that big wick on the left. There is possibility to make similar kind of wick under POC level.
Avalanche Avax usdt daily analysis Time frame daily Risk rewards ratio >3.5 👈👌
Target 31$
3times avax couldn't break the 26.4 $ resistance line and dropped down .
This time I hope it will be done .
The great benefits for traders if avax can break
LS is not very tight this time . Really I scared of hunters and may be we have a bad shadow so I put my LS farther.

AVAX - NEUTRAL AREA WEEKLY. CRYPTOCAP:AVAX - update:
Neutral on the daily basis.
No price direction & Very neutral zone .
Levels to watch:
25.30 - 35.30
Locals supports:
28.80 - 28.150 - 27.00 - 25.30 - 25.00
No direction yet, neutral on almost all TF.
On the H1 view, do you see a bearish flag, or an ascending channels? 👀
Bullish area & HTF consolidation possible above 25.00$
A buy signal could be trigger in case of weekly candle break above 35.50$! 🎯
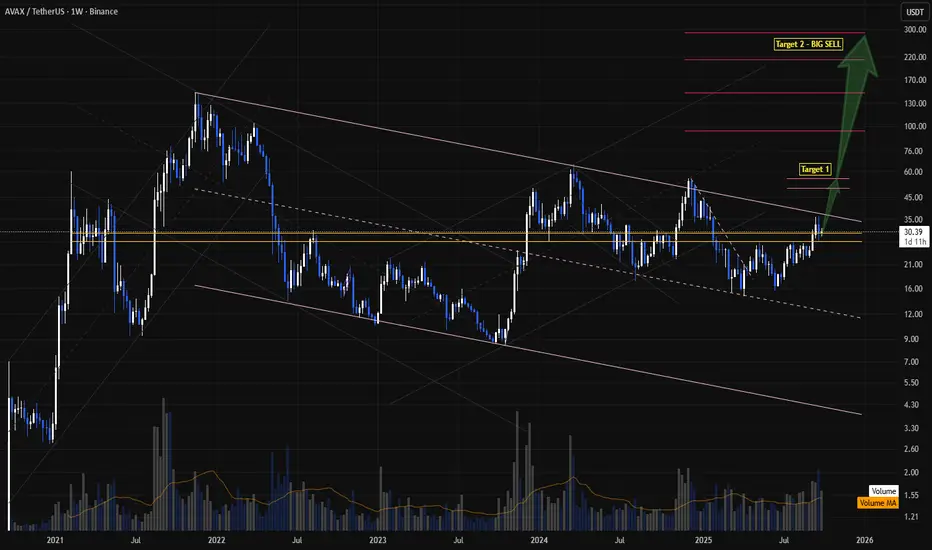
AVAX: My portfolio leader with massive upsideHey everyone,
The leader of my portfolio by share is Avalanche (AVAX), making up about 17%. I see huge potential in its wide range of use cases, and I’m especially excited about the prospects of AVAX ETFs, international collaborations in gaming and RWA industries, and the strength of the core team as we head into the next altcoin move.
I believe AVAX could potentially climb into the Top 10 in crypto market cap during this cycle. For the first target, I see the $50–55 range as a reasonable zone for some profit taking or portfolio rotation, though I haven’t finalized my plan yet.
My main goal is to hold at least until ATH levels, but ideally I’d like to see it reach around $250.
As always, these are just my personal thoughts and not financial advice. Please do your own research.
Cheers!
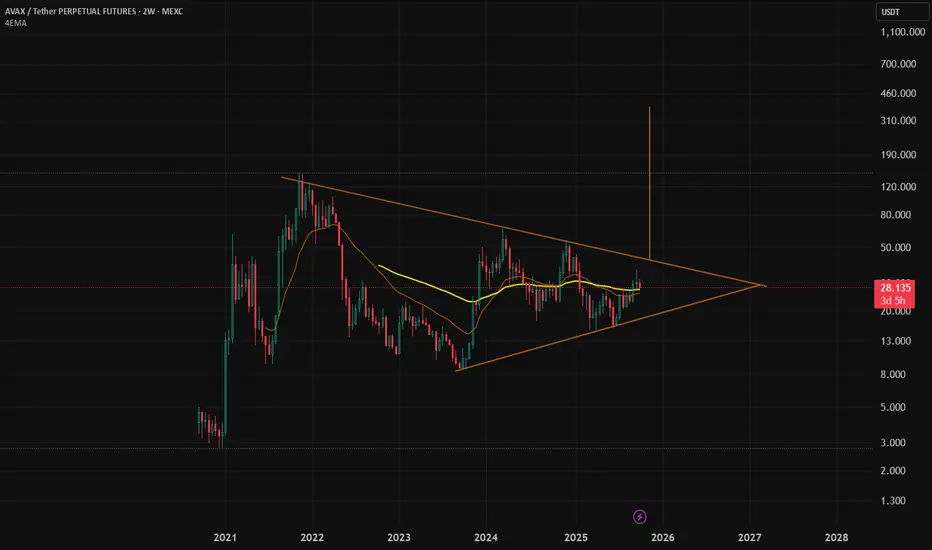
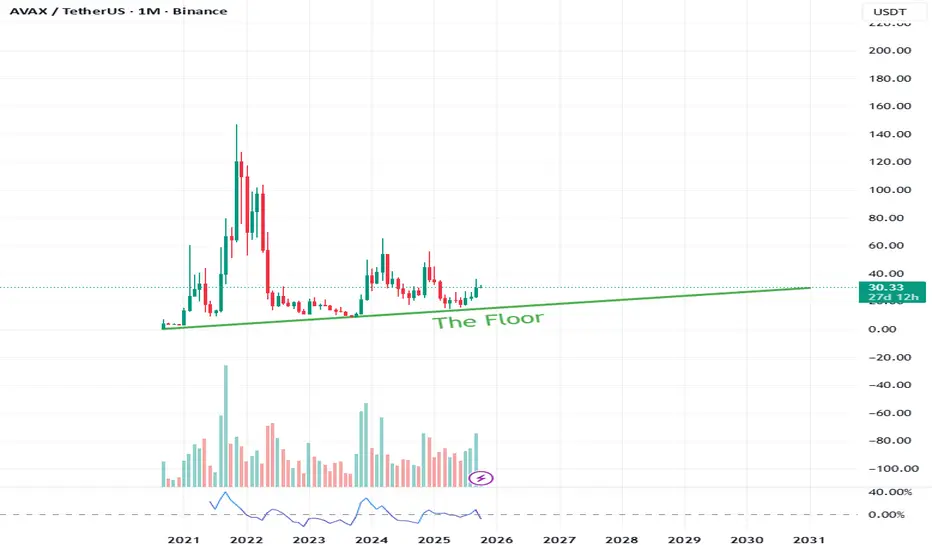
The floor support for $avaxWith the monthly chart we can clearly see a bounce from the floor around $15 for $avax.
I sense extreme bullishness may influence prices in Q4 of 2025.
Avax Seasonal TrendsIf we look back to previous sessions in Q4 we see a repeating pattern of bullish market conditions. I would expect the same this year of 2025 and remember never be surprised how quick the market changes.
AVAX - For new long Price MUST stay above $27AVAX - For new long Price MUST stay above $27
AVAX price is dropping as BTC price - but it's only one coin that btoke long range
was that break up real?? or simply a fake
watch an update to learn all my thoughs

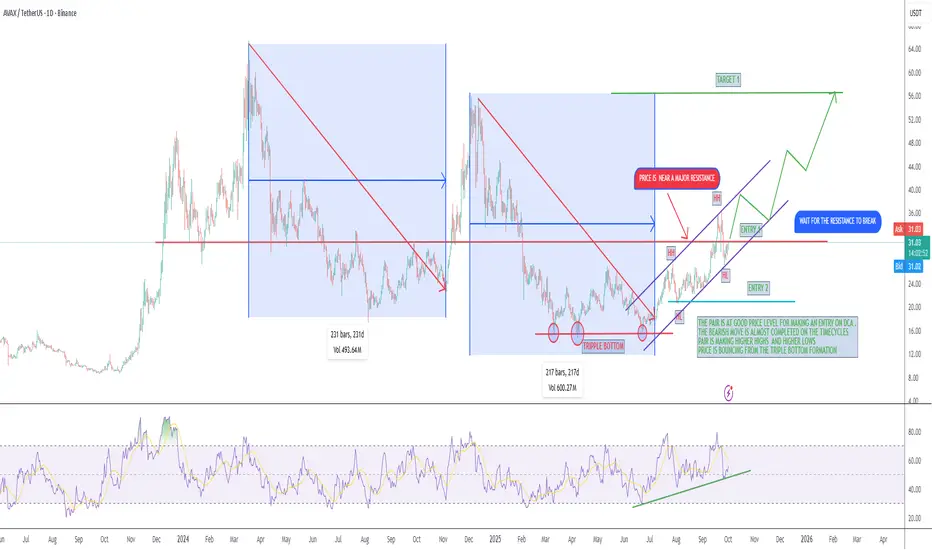
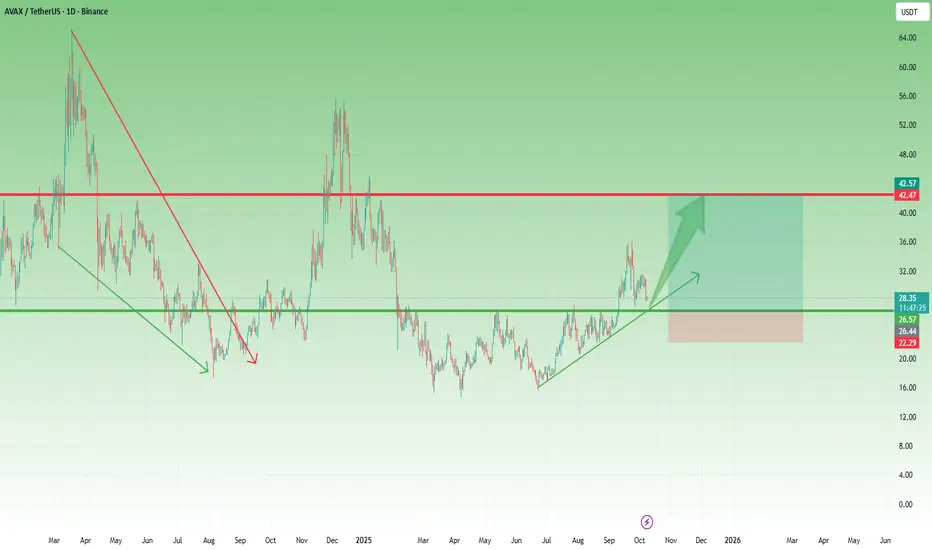
AVAX/USDT IS AT LUCRATIVE LEVELS TO ENTER THE BULL RUNThe pair AVAX/USDT seems to be in a bullish run as the price is bouncing from the Triple Bottom formation and making new HH's and HL's and respecting the trend lines.
we can enter the pair for a long with building positions on DCA and if the price comes below we can make another entry on DCA.
The ALT's Season is expected and the pair may give good results.
What are your views ??????