#AVAXUSDT: Targeting $60 Long Term View! Swing TradeThis crypto pair has a big potential of going back to its previous all time high, in our opinion price should reverse from $9 to $10 that area looks more appealing. We expect a swing volume to kick in the market.
Use accurate risk management while trading cryptocurrency. Like and comment for more.
Team Setupsfx_
Trade ideas


Avalanche AVAX price analysisCRYPTOCAP:AVAX right on the bottom of the 2-year channel!
The price of CRYPTOCAP:AVAX is once again touching the lower boundary of a massive channel that has been forming for more than 24 months.
And what’s interesting — #Avalanche has strong fundamentals, active development, and a “starting” market cap of $5.5B 💰
📈 So… is it finally time for OKX:AVAXUSDT to move up?
🔹 Conservative target: +100% → $26
🔹 Ambitious but realistic: upper channel → $41–42 (+225%)
Looks juicy, right? 🤔
Do you think CRYPTOCAP:AVAX is gearing up for a breakout — or are we in for another round of accumulation?
______________
◆ Follow us ❤️ for daily crypto insights & updates!
🚀 Don’t miss out on important market moves
🧠 DYOR | This is not financial advice, just thinking out loud

AVAX - LONG - SQUEEZE TRAIN LOADING Traders,
I believe CRYPTOCAP:AVAX is getting ready to load a squeeze train upwards. This move might be quick, fast and harsh, the kind of reversal that catches traders off guard and leaves late shorts wondering what just happened.
Price has returned to a deep support zone where two separate Fibonacci retracements align. The 0.786 level from the A to B leg sits exactly at the current price. The 0.886 level from the C to D leg lands in the same place. When two independent fib legs converge like this, it often marks a high interest area where stronger hands quietly position and wait.
Before reaching this zone the market swept the Sunday wick. Sunday wicks are created during thin weekend volume without meaningful institutional presence. Because they form on weak liquidity, the market tends to revisit and clear them once real volume returns. Sweeping this wick removed weak weekend longs, cleaned the structure and collected liquidity needed for a sustained move.
Order Flow is lining up. Spot buyers are absorbing selling while perp traders are shorting into the lows. Spot CVD is rising which shows genuine demand. Both coin margined and stablecoin margined CVD are falling which shows leveraged shorts pressing down. Net Shorts are increasing at the bottom. Open Interest is rising at the same time. This confirms new short positions are opening rather than closing. When spot accumulation meets leveraged short pressure at deep fib support, the stage is set for a squeeze.
The first target above is the 1.618 extension of the A to B leg. This is the expected continuation level after a deep 0.786 retracement. It also aligns with a higher time frame 0.786 level not shown here to keep the chart clean. Confluence at the target strengthens its gravitational pull.
AVAX has swept liquidity, tapped strong fib confluence and attracted late shorts into the structure. All the ingredients for a fast upside squeeze are present.
Summary
• Two fib retracements meet at the current level
• Sunday wick swept which removes weak weekend positions
• Spot CVD rising which shows real buying
• Perp CVD falling which shows leveraged short pressure
• Net Shorts rising at the lows
• Open Interest rising which confirms new shorts opening
• Squeeze conditions forming
• First target is the 1.618 extension of A to B
• This target aligns with a higher time frame 0.786
Final Thought
The market does not shout its intentions. It whispers through structure, flow and confluence. Deep retracements, cleared liquidity and patient accumulation often appear right before sudden expansion. CRYPTOCAP:AVAX feels ready to shift tone and when it does, the shorts gathered at the lows may find themselves riding the squeeze train the wrong way.
Targets and Invalidation
My first target is 17.115, which aligns with the 1.618 extension of the A to B leg and fits the structure of a classic deep retracement continuation.
My second target is 22.5, a level that connects beautifully with mid-range liquidity left behind on the way down and acts as a natural expansion point once the first target is cleared.
For the more mid to long term, I am watching 31.25, which sits directly inside a higher time frame inefficiency zone and marks the beginning of true trend continuation rather than a simple corrective squeeze.
Invalidation sits cleanly at 12.275, the low of point A. If price breaks below that level, the structure of the current idea collapses and the setup no longer fits the narrative of a squeeze. Until that level is violated, the bullish structure remains intact and the path of least resistance stays upward.
----------------
If you like this analysis, feel free to leave a like or a comment. I am not asking for money and I am not trying to sell anything. I simply enjoy helping people look through the noise and understand the structure beneath the chaos.

AVAX/USDT : LIVE TRADEHello friends
Considering the decline I had, you can see that the price has been supported in our support area and the price has grown well.
Now, given the good growth we had, we have a high and low, which is a sign of the entry of sellers, and this means that the price will correct to the specified areas, and from there we can again expect the price to grow to the specified targets.
This analysis is technically reviewed and is not a buy or sell recommendation, so please follow risk and capital management.
*Trade safely with us*

A short setup on AVAXUSDT Based on the powerful Ichimoku Cloud system, after a prolonged bullish move we can now expect a significant corrective/bearish leg.
Looking at it from a fully bearish/pessimistic perspective, there’s a high-probability short setup offering at least a 1.5:1 reward-to-risk ratio (potentially much higher if momentum continues).
If you’d like to stay in touch, get daily signals, live trade management, or interact directly, feel free to reach out to @VIPSUPPORT9 on Teleram.
Trade safe! ⚠️ Not financial advice.

AVAX – 15m Technical Analysis (Breakout Setup)🔥 AVAX – 15m Technical Analysis (Breakout Setup)
( BINANCE:AVAXUSDT )
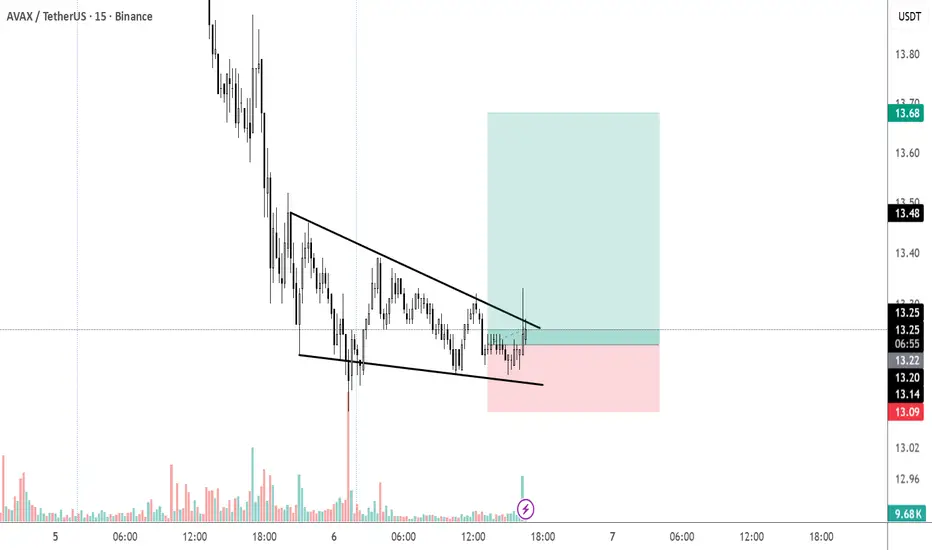
✅ 1) Pattern Analysis – Falling Wedge
A falling wedge usually signals that sellers are weakening, and buyers are absorbing liquidity.
What confirms the breakout?
Price broke above the wedge’s upper trendline.
A large bullish candle with increased volume.
Retest area around 13.20–13.25, which is happening now.
📌 This is a classic bullish breakout behaviour.
✅ 2) Entry Logic
The entry around 13.25 is technically correct because:
It's exactly at the breakout retest zone.
Buying pressure is visible.
Volume supports continuation.
This setup is high probability when supported by volume (which is clearly rising).
✅ 3) Stop Loss (SL)
Your SL below 13.05 – 13.10 is perfect because:
It sits below the wedge structure.
If price returns below this level, the breakout becomes invalid.
This is the correct technical placement.
✅ 4) Take Profit (TP) Projection
Your TP zone around 13.70 – 13.80 is realistic and matches:
Previous major support turned resistance.
Measured move of wedge height placed at breakout.
High-volume node from earlier.
✔ Expected targets:
TP1 → 13.48 (first resistance)
TP2 → 13.68 (upper range)
TP3 → 13.78–13.80 (full wedge target)
✅ 5) Market Behaviour to Expect
After a falling wedge breakout, price typically:
Breaks the trendline ✔
Pulls back slightly to retest the breakout level
Then accelerates upward toward targets
Reverse head and shoulders on AVAX/USDT monthly graph23.43 is approximate resistance, 81.99 approximate target .
Reverse head and shoulders on Avax/USDT monthly graph.

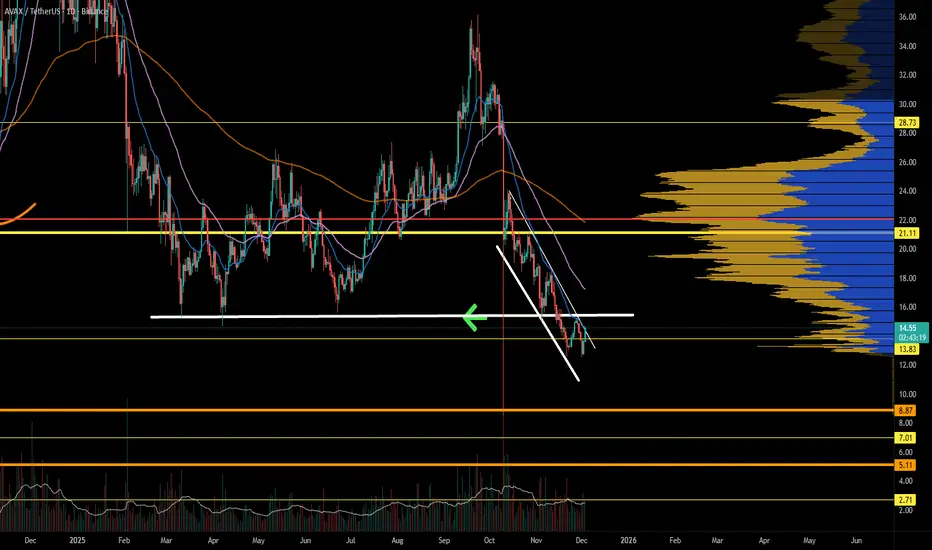
AVALANCH is watch list material. AVAX is still trading inside a clear descending channel, but the structure is beginning to show early signs of exhaustion from sellers. Price is sitting right on a major historical demand zone, one that has acted as a pivot multiple times in the past.
Momentum indicators are showing something the chart hasn’t offered in months: repeated bullish divergences across momentum and trend oscillators. Each new lower low in price is being met with a higher low in momentum. That’s often the first signal that a trend is preparing to shift.
The volume profile also shows a heavy concentration of interest just below current price. If buyers can hold this region, the next high-volume node doesn’t appear until much higher, suggesting potential room for a sharp relief move.
The key levels remain the same: hold the floor, break the channel, and the trend changes. Lose the floor, and the chart goes deeper into the lower ranges.
AVAX is approaching a point where the risk-to-reward begins to favour the patient. Watching closely for a clean break back in the range and confirmation from momentum.
What are your thoughts on AVAX here?
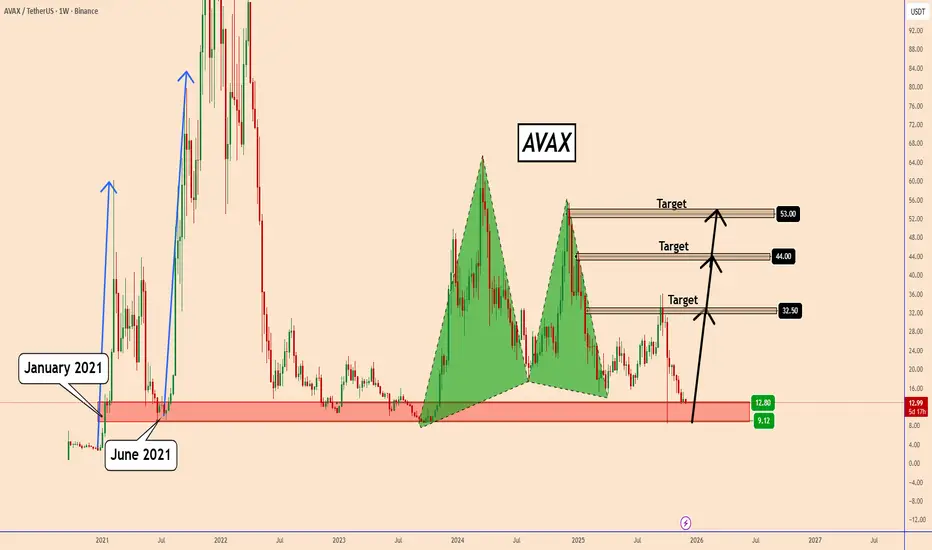
AVAX: Poised for a Major Bullish SurgeAVAX: Poised for a Major Bullish Surge
AVAX is currently retesting a long-standing support area that was previously respected in both June and January of 2021. The zone between $9–$12 has acted as a strong floor for several years and has not been decisively broken. This suggests that downside risk may be limited in this region.
On the daily chart, AVAX has already completed a bullish structure, increasing the probability of a future upward move.
⚠️To be clear, I am not expecting an immediate rally, but this is the area I’m monitoring closely for a potential long-term accumulation or trading opportunity.
I’m focusing on realistic targets that the price has successfully reached in the past:
Key Targets:
$32.5
$44
$53
You may find more details in the chart!
Thank you and Good Luck!
❤️PS: Please support with a like or comment if you find this analysis useful for your trading day❤️
AVALANCHE is on the verge of a major bullish move! (3D)Based on the structure we previously shared for AVAX in this post (), it seems the same structure is being followed.
The price appears to be in a large ABC, where wave B is a major diametric, and wave G of this diametric is still remaining.
Wave G could complete within the green zone
After this diametric finishes, we expect the price to enter the large wave C
Touching the invalidating level would negate this view.
For risk management, please don't forget stop loss and capital management
When we reach the first target, save some profit and then change the stop to entry
Comment if you have any questions
Thank You

AVAX Trade Setup – Watching the Pullback Opportunity!AVAX has rallied hard overnight, showing strong bullish continuation. After such a sharp move, we’re now expecting a short-term pullback, which could provide a great opportunity for a long spot entry.
🔹 Entry Zone: $12.50 – $13.50
🔹 Take Profit Targets:
• TP1: $18.50 – $21.00
• TP2: $24.00 – $27.00
🔹 Stop Loss: $12.00
If price retraces into the highlighted zone, this could mark a strong risk-reward setup for trend continuation. Keep an eye on momentum and volume confirmation before entry.

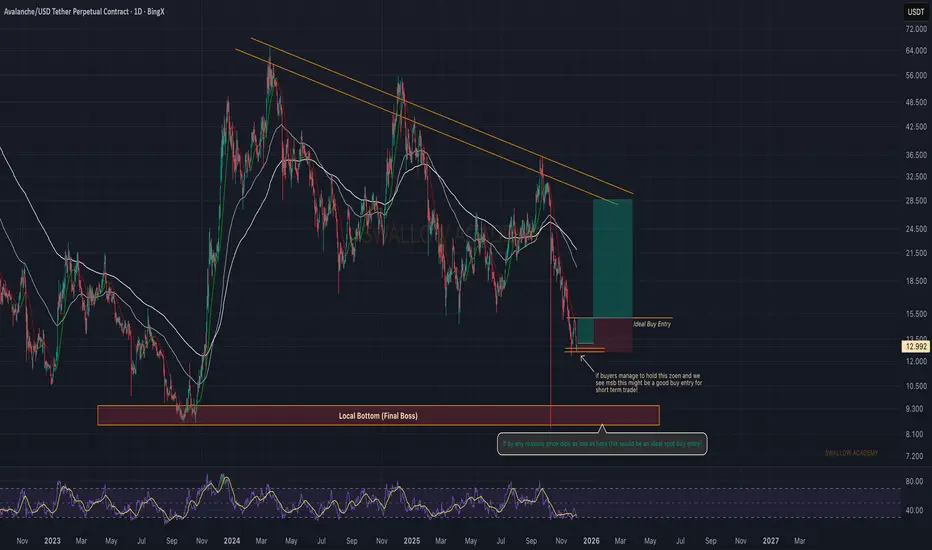
Avalanche (AVAX): Looking For Market Structure Break | BullishAVAX is sitting inside an important zone where buyers usually show interest, and we can already see the market slowing down around this area. If buyers manage to hold this level and we get a proper shift in momentum, this could open a solid short-term long setup with a clean R:R.
For the long-term trade, the gameplan stays simple — if price dips deeper into the final liquidity zone below, that would be the ideal buy spot for a bigger swing entry. Until then we just wait for buyers to prove themselves at current levels and react accordingly.
Swallow Academy
AVAXUSDT 1D#AVAX has broken above the falling wedge pattern on the daily chart. In case of a successful retest, the potential upside targets are:
🎯 $16.96
🎯 $18.32
🎯 $19.68
🎯 $21.61
🎯 $24.07
⚠️ Always remember to use a tight stop-loss and maintain proper risk management.

Long trade Wed 26th Nov 25 — 3:25 PM
NY Session PM
Entry TF: 5-Min
🟩 1. Trade Parameters
Pair: AVAXUSDT
Direction: Buy-Side
Entry: 14.557
Stop Loss: 14.400
Take Profit: 15.577
Risk–Reward: 8.43R
🟨 2. Higher-Timeframe Context
HTF (1H / 4H) market structure:
Market has been in a multi-day downtrend, forming successive lower-lows and lower-highs.
A major demand zone between 13.12 – 13.30 was reclaimed on 23rd Nov.
Strong NY expansion candle broke above compression on 25th Nov, signalling a likely HTF shift.
Price pulled back into discount, forming a textbook re-accumulation structure.
30min TF overview
🟧 3. Liquidity
Liquidity Taken (Before Entry)
Sweep of Sunday–Monday lows around 13.12.
Deep purge into demand zone engineered equal-lows → liquidity grab.
Market created inducement wicks at 14.12, which were later swept.
Liquidity Above (Targets)
Buy-side liquidity pool at 15.57 (clear cluster of prior highs).
Multiple FVGs above price requiring rebalancing.
Void left from the sharp selloff on Nov 18th → price required re-pricing into inefficiency.
Liquidity narrative:
Sweep → Accumulation → Reclaim → Displacement to inefficiency.
5min Chart
🟥 4. SMC / ICT Technical Model Breakdown
✔ Model Type: BOS + FVG + Re-Accumulation Breakout
BOS at ~14.25 confirms shift back to bullish orderflow.
Clean FVG (14.22–14.28) formed after displacement.
Price returned to the FVG → mitigated OB → tapped equilibrium.
Strong continuation displacement candle printed → ideal entry timing.
Key Confluences:
Demand zone → BOS → FVG → OB alignment
EMA/WMA bullish crossover
Tight SL under engineered liquidity
🟦 5. Entry Logic
The entry at 14.557 acted as the:
Re-accumulation breakout confirmation
Retest of micro FVG
Retest of prior resistance turned support
SL placement below 14.400 protected under:
✓ Equal lows
✓ OB mitigation
✓ Structural swing low
🟫 7. Trade Outcome
Status: In session

AVAXUSDT spot investment or swing tradeThere was a massive bullish news on AVAX blockchain, "In the New York suburb of Bergen, one of the wealthiest counties in the United States, the country's largest real estate tokenization project on the Avalanche blockchain is launching.
Over the next five years, it is planned to transfer 370,000 property deeds, which in total will amount to about $240 billion." This is a long standing asset that recommended itself as a reliable blockchaing and survived in a tight competitiveness. Waiting for $70+ on a bullish market is a bare minimum for me.


Algotrading AVAX longPress "Grab this chart", run strategy tester since 2020 and make sure that is good time for a long to yellow line

AVAXUSDTIn the daily timeframe, there is a strong resistance zone around $15, which can be considered the first target. If this resistance is broken and price manages to hold above the breakout level, higher targets will become accessible.

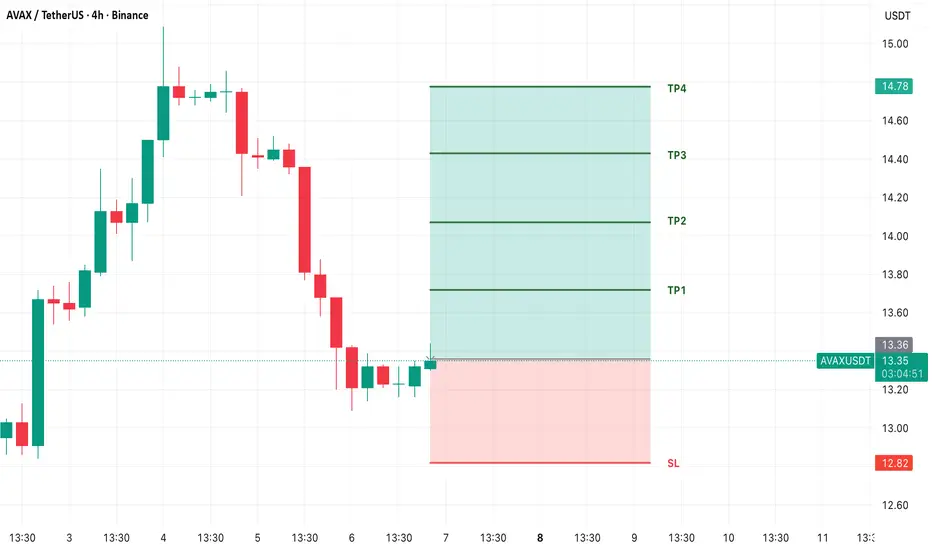
AVAX LONG TRADE SETUPNew Trade Setup: AVAX-USDT
LONG
Entry: 13.36 or CMP
Target: TP1: 13.72, TP2: 14.07, TP3: 14.43, TP4: 14.78
Stoploss: 12.82
Leverage: 1X
Technical Analysis: AVAX/USDT is bouncing from support on short timeframe with a high probability of moving up to test the next resistance level.
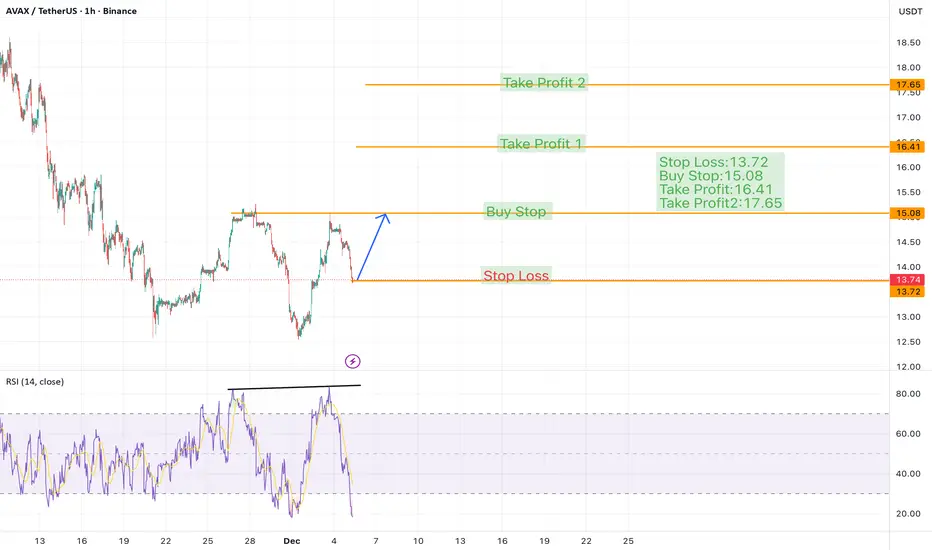
AVAX/USDT Chart Analysis 5-Dec-25Stop Loss:13.72
Buy Stop:15.08
Take Profit:16.41
Take Profit2:17.65
In 1H Chart Pattern (Inverse Head and Shoulder) has been predicted if it hit the price tag of (15.08) then we can expect the price to hit (17.65).
⚠️ Always remember to protect your capital with a proper stop-loss and disciplined risk management.
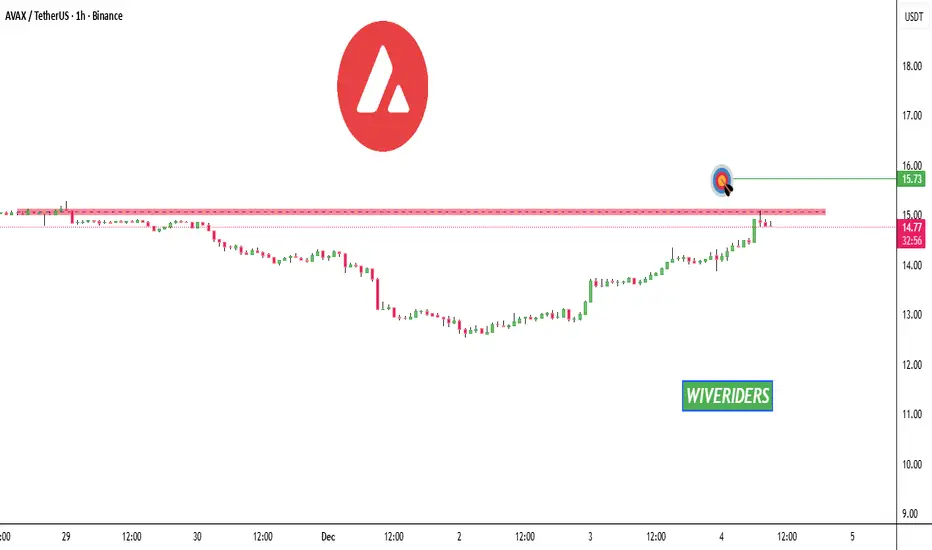
AVAX Update🚨📊 AVAX Update
AVAX is testing the red resistance zone 🔴.
If breakout happens, first target = green line level 🟩🎯.
AVAX 8H – Liquidation Wick Above, Liquidity at $8.69 Below?AVAX printed a large liquidation wick on October 10th, creating an inefficient displacement that price has been unwinding ever since. Structure has remained clean: lower highs, lower lows, and continuous rejection from the 50/100 EMAs.
The current bounce is interacting with dynamic resistance from the 50 EMA. Unless price can reclaim the 100 EMA and break back into the 0.5–0.618 Fib zone, it remains a lower-timeframe corrective move inside a broader downtrend.
The key level on this chart is the $8.69 macro liquidity line, which aligns with the base of the previous bull run (as shown on the 1D inset). That level has remained untouched and stands out as a major liquidity pool if bearish structure continues.
Short-term: watch for a lower-high formation around $13–$14.
Higher timeframes: liquidity below remains the dominant draw.
