AVAXUST trade ideas


AVAXUSDT at 4h support, likely to head towards 14The price the weekly resistance WR1 and got rejected from there. This rejection led the price to hit 4h support 4HS1. This support seems to be good one for a bounce and attempt to the weekly resistance again. Therefore, a long seems to be favorable from this level to price zone around 14. However, in case this support is lost, the daily support DS1 is another level where the price will find the support and a bounce will be favorable for the long trade towards the zone where currently 4h support 4HS1 lies.

AVAX/USDT bullish Scenario 🚀🔥Avax today analysis💎 AVAX is primed for an upward trajectory, as indicated by the RSI trading above 50, signaling positive momentum.
💎 Currently, it's retesting the demand zone and appears poised for an upward move. We've previously observed the demand zone transforming into a supply zone following market uncertainty.
💎 Above, there's a supply zone and a bearish order block that warrant attention.
💎In the dynamic world of crypto, staying informed and adaptable is key. Stay tuned for more updates and enjoy your trading journey

AVAX/USDT15 mWith my personal strategy, I take a long position until the target of 13.85
I made this decision due to the reversal of the trend and Kendali's confirmation BINANCE:AVAXUSDT

a long setup for avaxI see a good liquidity to trade in the market
I discovered this situation with my own style

Avax possible moveKeep an eye for possible short position
Not an financial advice
Always DYOR
Good luck

Avax Signal: 3 positionShort - EP: 13.904 SL: 13.251
Long - EP: 13.249 SL: 14.465
Short - EP: 14.465 SL: 12.936

The 12.40-17.15 section is the buy sectionHello?
Traders, welcome.
If you "Follow", you can always get new information quickly.
Please also click "Boost".
Have a good day.
-------------------------------------
(AVAXUSDT chart)
Looking at the 1M chart,
A rise above 17.70 is expected to sustain the price before a full-fledged uptrend begins.
Looking at the 1W chart,
Currently, it is located in the section formed by the HA-Low indicator on the 1W chart.
Therefore, the key is whether it can rise with support in the current section.
However, since the HA-High indicator on the 1W chart is located nearby, it is not easy to actually buy.
The reason is that the resistance zones are so close together.
If the HA-Low and HA-High indicators are close together, you can see that they are converging as you can see by looking at the Bollinger bands.
Therefore, in this case, it is necessary to check whether it is supported or resisted in the section consisting of the HA-Low and HA-High indicators, and it corresponds to the buying section.
An upward breakout of the 19.73-23.96 zone is expected to release the converged forces.
To put the above 1M chart description and 1W chart description together,
If support is found at 17.70 on the 1W chart's HA-High indicator, it can be said that the uptrend is expected to begin.
Looking at the 1D chart,
The support and resistance points of the 1M, 1W, and 1D charts are combined in order of importance.
Therefore, many lines are drawn.
The interval of the HA-Low indicator on the 1W chart is the range of 12.40-13.83.
Therefore, if the price rises from support in this zone, it is more likely to break out of the downtrend line and continue the uptrend.
Accordingly, the key is whether the price maintains the price by rising above 13.83 based on the volatility period around July 15th.
If this is not the case and it declines, you should check for support near the HA-Low indicator on the 1D chart. (11.56-11.80)
The 14.99-17.15 section consists of the HA-High indicator on the 1W chart.
Therefore, it is expected that the price will turn into an uptrend only when it breaks above this section.
As I mentioned earlier, it is expected that a full-fledged uptrend will begin when the upward break of the 17.15-17.70 section and the 19.16-19.73 section.
-------------------------------------------------- -------------------------------------------
** All descriptions are for reference only and do not guarantee profit or loss in investment.
** Even if you know other people's know-how, it takes a considerable period of time to make it your own.
** This is a chart created with my know-how.
---------------------------------


AVAX Avalanche Double BottomAVAX (Avalanche) has shown a promising chart pattern with the formation of a double bottom, indicating a potential bullish reversal. This pattern suggests that the selling pressure has been absorbed, and a shift towards upward momentum may be on the horizon.
With the double bottom formation in place, AVAX has the potential to rally, and the first price target of $17 seems achievable. As the market sentiment improves and buying pressure increases, AVAX could experience a notable price appreciation.
Looking forward to read your opinion about it!

AVAXUSD ❕ uptrendAVAX has broken through 50EMA on the 4H TF.
RSI in the buy zone on 4H TF.
50EMA broke up 200EMA on 1H TF.
The asset will continue to rise if it holds support.
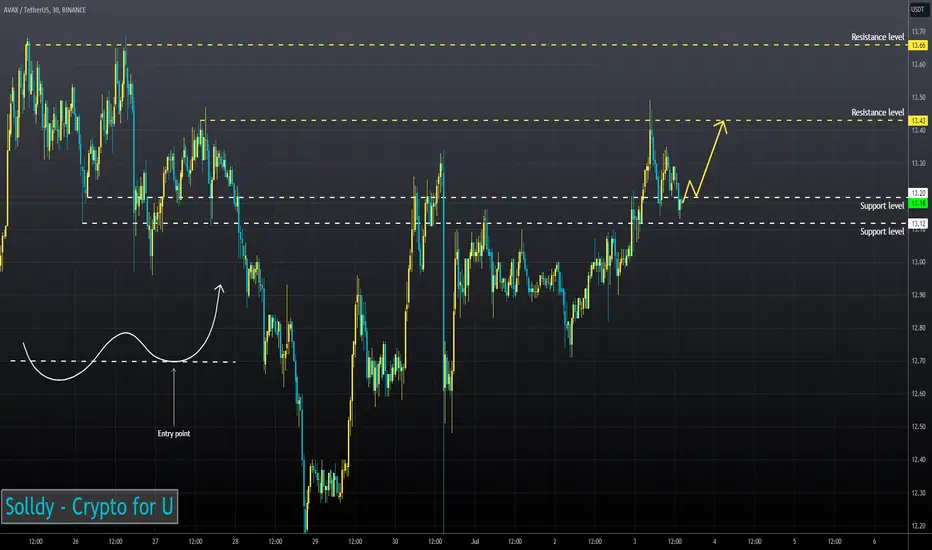
AVAX shortAVAX bounced off the resistance level. Asset bounced down off the bearish trendline. Decline to support level at 11.2 is expected to happen.

TRADE OF THE DAY | AVAX showing potential 60%TRADE OF THE DAY | AVAX showing potential 60%
After a strong rejection from a strong historical support and a breakout and retest from significant trendline, further confirmation from a breakout on the RVD.
Looking like big move up incoming

#AVAX $AVAX where is it heading the next year?!Can we see #AVAX $AVAX above 500$ in 2022?! lets wait and see, Good Luck!

AVAX - D UpdateThe downside continued as expected and even made a lower low.
So, in terms of EW analysis, we could be looking at a flat correction, which would be in the final stages of Wave B.
Considering that there is still no RSI divergence in place, I expect another wave down before wrapping up black wave B.

Retesting the channel upper band.Looks like we are testing for the channel upper band. If it breaks no one can hold the AVAX

AVAXUSDTAgain, I think AVAX hasn't finished its 5-star downtrend, so I'm waiting for it to arrive
Remember the $4 price tag
The descending triangle pattern should be completed and then the price will go up
Just a theory

SasanSeifi 💁♂️AVAX👉1D 🔻▪️ Hello everyone ✌️
As you can see, after the almost 30% price drop from the 14$ price range; Currently, the price is trading in the 11$ range.
According to the behavior of candles, the scenario we can consider in the daily time is that if the support range of10$ is maintained, the price will grow to the Fair Value Gap-FVG range of 12.50$ and the important resistance range of 14$. And then, if it is confirmed from the resistance range, we will see the price correction.
In case of a positive fluctuation, to better understand the continuation of the movement process,We have to see how the price will react to the resistance ranges. Otherwise, in case the price penetrates above the important resistance range of 14$ and stabilizes it, We may see more price growth. Possible trends are also identified.
❎ (DYOR)...⚠️⚜️
What do you think about this analysis? I will be glad to know your idea 🙂✌️
IF you like my analysis please LIKE and comment 🙏✌️

AVAXUSDT.1DHello Crypto Lovers, This is a 1D frame analysis for AVAXUSDT.1D After the pullback, the price started to move towards the first resistance line and is currently below it. If the price cannot establish itself above the resistance line, we can expect a corrective price movement, but if it breaks the resistance line, we can expect an increase in price to break the second resistance line. Currently, the price is not showing any particular trend and we should wait for an upward or downward movement towards the support or resistance lines. Warning: This is just a suggestion and we do not guarantee profits. We advise you to analyze the chart before opening any positions. Take care

AVAXUSD ❕ correctionTD Sequential has formed a down reversal signal (4H TF)
RSI is moving into overbought area (4H TF)
Trading volumes declined.
The price chart and RSI form a bearish divergence on the 1H Timeframe.
I believe that AVAX will correct after overcoming the support.

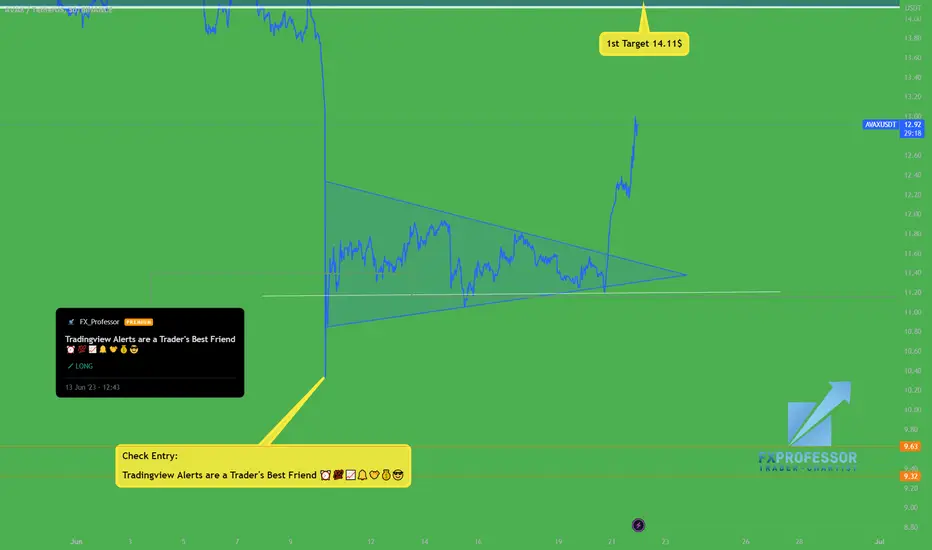
AVAX- Updated Chart and 14.11 ResistanceNobody is perfect and i do make mistakes as well. One of them was closing my whole position early after an epic entry:
AVAX is going strong together with Bitcoin but we need to mind the 14.11 resistance which is a big one. After that 16.35 is the Key All time S/R and a proper Bull Run is over that levels.
Keep you posted!
One Love,
The FXPROFESSOR
🔥 AVAX Bear Market Lows Are In: Double BottomAVAX has recently made a new bear-market low, but only by a couple of percent during a sell-off wick. This trade assumes that the 10.00 low will be the bear-market low, which means that the only way forward is to go up.
Target for the long-term (think 1-2 years) is the current all-time high, which also gives a great risk reward of ~46.
You can take partial profits around 30.00 and 52.00 if you're more risk averse.
