AXS USDT LONG SIGNAL📢 AXS/USDT – Trade Setup (LONG)
📈 Position Type: LONG
📊 Market: Futures / Spot
🕒 Timeframe: As shown on chart
💰 Entry Zone:
1.34 – 1.29
(Price reacting from demand zone & descending wedge support)
🛑 Stop-Loss:
1.24
(Below key structure & invalidation level)
🎯 Take-Profit Targets:
• TP1: 1.52
• TP2:
Related pairs

AXS the entry of that 10x signal hit again AXS is once again testing a critical support zone near $1.10, a level that has historically attracted significant buying interest. This area represents a major technical foundation from which a renewed bullish impulse could emerge.
Immediate Target:
Should the support hold and a confirmed reversa

AXSUSDT.P: short setup from 4h support at 2.043BINANCE:AXSUSDT.P has entered a consolidation phase following a strong rally. This range is wide enough to allow for trading inside the structure.
I have identified a local level, relying primarily on the 4H timeframe. The asset has been trading just above this support for an extended period. Rece

AXSUSDT Ready to Explode? Channel Break Could Trigger Relief!The Axie Infinity / USDT pair on the 4H timeframe is still within a mid-term downtrend structure after failing to hold the supply area around 2.9 – 3.0 USDT.
Price action continues forming consistent Lower Highs (LH) and Lower Lows (LL), indicating strong seller dominance. Currently, price is conso

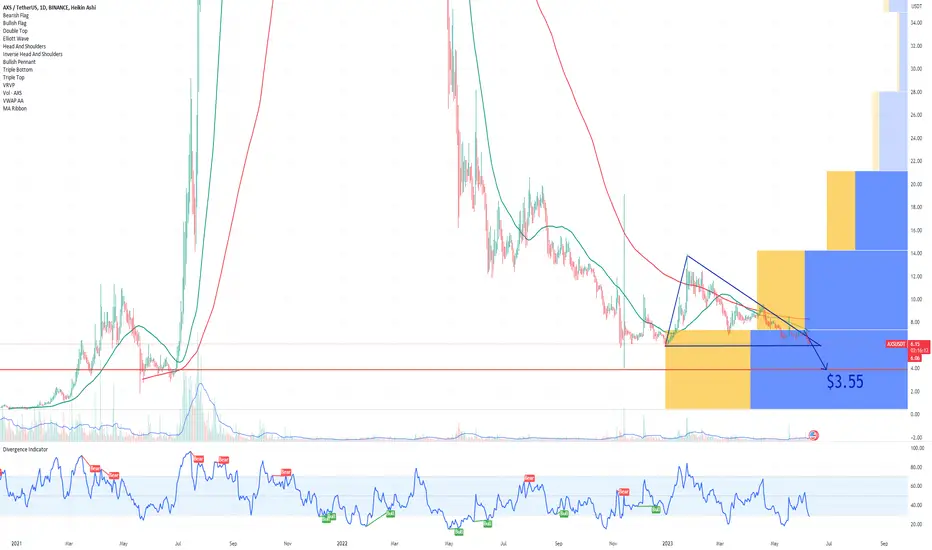
AXS Axie Infinity Triangle Formation BreakdownI don`t know if you have seen my preview AXS chart that had more than 500 Likes:
In its recent case against Binance, the SEC introduced 10 cryptocurrencies into the securities classification: BNB (BNB), Binance USD (BUSD), Solana (SOL), Cardano (ADA), Polygon (MATIC), Cosmos (ATOM), The Sandbox (S
AXSUSDT 10$ is not dream anymore simple to hit soon(Price: 2.5$)As previously forecasted, AXSUSDT has realized a strong advance from the $1.00 level, reaching approximately $2.50 at present. This move likely represents the initial phase of a broader bullish structure.
The next primary technical target is projected near the $10.00 zone, which would equate to a r

AXS NEXT LONG TARGET IS $2.999Give this idea a thumbs up if you agree 👍
Axs 1hr timeframe is trending upwards to break out of the previous high

AXS at ExtremesAXS: Objectives Met
Both Elliott Wave 5 and the ABC sequence have fully completed at the same region, suggesting the upside expansion has done its job.
At this stage, continuation is still possible — but probability shifts only if structure changes.
The marked support zone is the key:
• As

AXS: two 40% pumps are coming...Hi!
AXS remains in a clear uptrend, trading cleanly inside a rising channel. Price held the mid-range support and is now pushing higher, suggesting buyers are still in control. As long as the lower channel support holds, the structure favors continuation.
The next upside objectives align with the

Axie Infinity AXS price analysisAfter spending more than three years in a sustained downtrend, CRYPTOCAP:AXS price action over the last month resulted in an approximately x3 increase, supported by improving volume dynamics.
Key observations:
Clear break from long-term bearish structure
Strong short-term momentum on OKX:AXSUSDT

See all ideas
Summarizing what the indicators are suggesting.
Oscillators
Neutral
SellBuy
Strong sellStrong buy
Strong sellSellNeutralBuyStrong buy
Oscillators
Neutral
SellBuy
Strong sellStrong buy
Strong sellSellNeutralBuyStrong buy
Summary
Neutral
SellBuy
Strong sellStrong buy
Strong sellSellNeutralBuyStrong buy
Summary
Neutral
SellBuy
Strong sellStrong buy
Strong sellSellNeutralBuyStrong buy
Summary
Neutral
SellBuy
Strong sellStrong buy
Strong sellSellNeutralBuyStrong buy
Moving Averages
Neutral
SellBuy
Strong sellStrong buy
Strong sellSellNeutralBuyStrong buy
Moving Averages
Neutral
SellBuy
Strong sellStrong buy
Strong sellSellNeutralBuyStrong buy
Displays a symbol's price movements over previous years to identify recurring trends.
Frequently Asked Questions
The current price of AXS / TetherUS (AXS) is 1.410 USDT — it has fallen −1.66% in the past 24 hours. Try placing this info into the context by checking out what coins are also gaining and losing at the moment and seeing AXS price chart.
AXS / TetherUS price has risen by 11.59% over the last week, its month performance shows a 36.68% increase, and as for the last year, AXS / TetherUS has decreased by −68.98%. See more dynamics on AXS price chart.
Keep track of coins' changes with our Crypto Coins Heatmap.
Keep track of coins' changes with our Crypto Coins Heatmap.
AXS / TetherUS (AXS) reached its highest price on Nov 6, 2021 — it amounted to 166.090 USDT. Find more insights on the AXS price chart.
See the list of crypto gainers and choose what best fits your strategy.
See the list of crypto gainers and choose what best fits your strategy.
AXS / TetherUS (AXS) reached the lowest price of 0.100 USDT on Nov 4, 2020. View more AXS / TetherUS dynamics on the price chart.
See the list of crypto losers to find unexpected opportunities.
See the list of crypto losers to find unexpected opportunities.
The safest choice when buying AXS is to go to a well-known crypto exchange. Some of the popular names are Binance, Coinbase, Kraken. But you'll have to find a reliable broker and create an account first. You can trade AXS right from TradingView charts — just choose a broker and connect to your account.
Crypto markets are famous for their volatility, so one should study all the available stats before adding crypto assets to their portfolio. Very often it's technical analysis that comes in handy. We prepared technical ratings for AXS / TetherUS (AXS): today its technical analysis shows the sell signal, and according to the 1 week rating AXS shows the sell signal. And you'd better dig deeper and study 1 month rating too — it's sell. Find inspiration in AXS / TetherUS trading ideas and keep track of what's moving crypto markets with our crypto news feed.
AXS / TetherUS (AXS) is just as reliable as any other crypto asset — this corner of the world market is highly volatile. Today, for instance, AXS / TetherUS is estimated as 9.15% volatile. The only thing it means is that you must prepare and examine all available information before making a decision. And if you're not sure about AXS / TetherUS, you can find more inspiration in our curated watchlists.
You can discuss AXS / TetherUS (AXS) with other users in our public chats, Minds or in the comments to Ideas.