Can #BAND Bulls Maintain this Momentum or Will Bears Win? Yello, Paradisers! Is #BANDProtocol breakout from the falling wedge legit—or are bulls walking straight into a trap? Let's dig into the latest setup of #BANDUSDT:
💎After trading for weeks inside a falling wedge, #BAND has finally broken out with solid momentum. The breakout above the resistance tre

BAND/USDT - Inverse H&SOn the 4H timeframe, BAND has formed a clear inverse Head & Shoulders pattern, signaling a potential bullish reversal. The breakout is already confirmed, with momentum building above the neckline.
The pattern projection suggests a first target at $1.00, which aligns with key resistance. A sustained

BAND (SPOT)BINANCE:BANDUSDT
#BAND/ USDT
Entry range (0.730- 0.720)
SL 4H close below 0.681
T1 0.99
_______________________________________________________
Golden Advices.
********************
* collect the coin slowly in the entry range.
* Please calculate your losses before the entry.
* Do not enter any

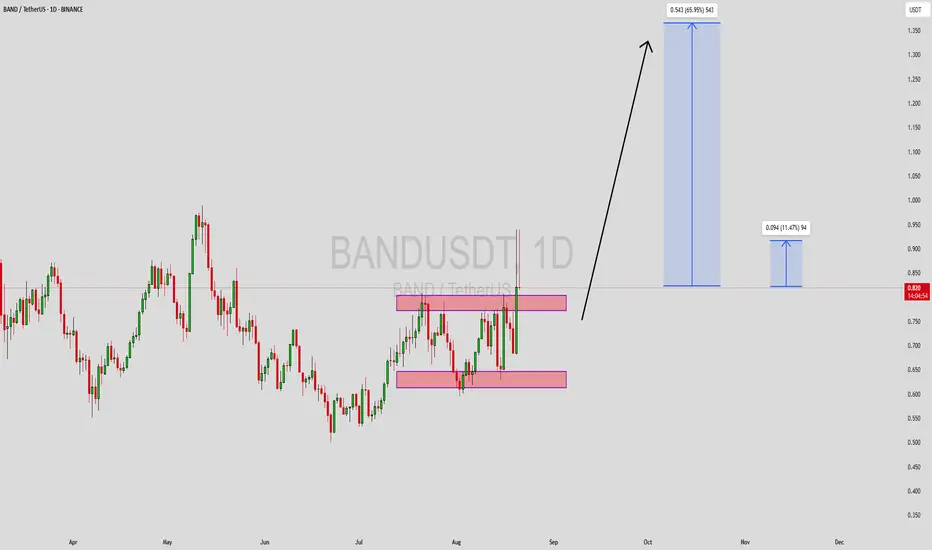
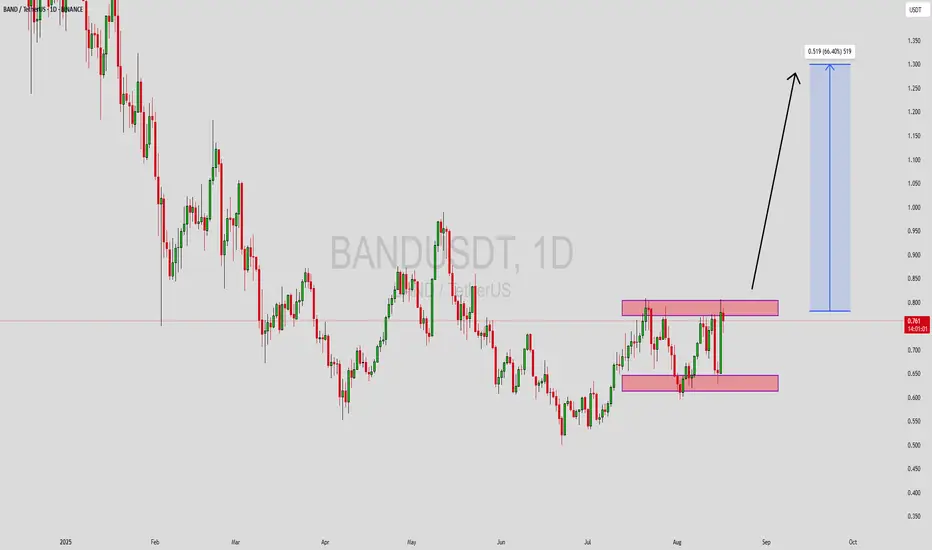
BANDUSDT Forming Potential BreakoutBANDUSDT is currently trading within a well-defined accumulation range and is showing signs of a potential breakout from key resistance. The chart reflects a consolidation pattern with a strong support base forming near the $0.65 zone, and resistance building near the $0.80 level. With increased vol
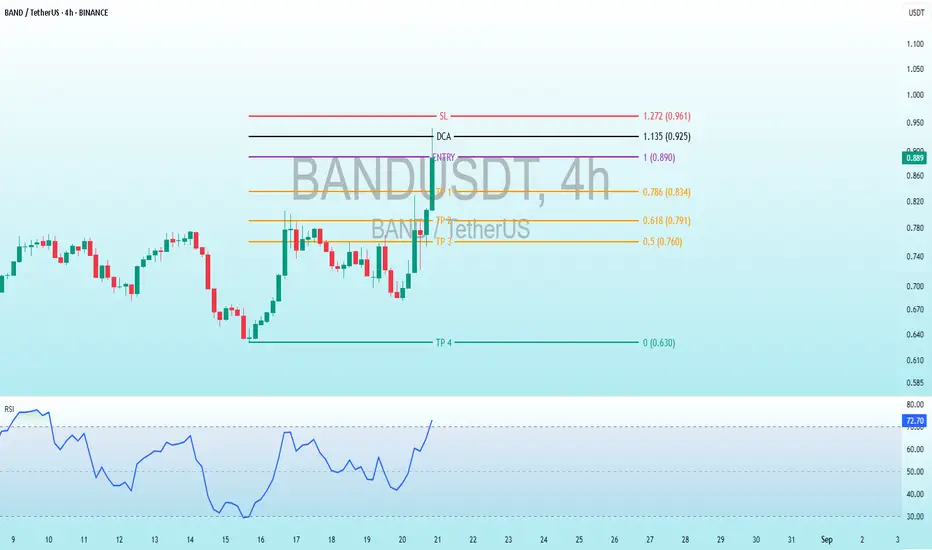
$BAND 4H Analysis: Bearish Targets with SL, DCA, and TP LevelsBINANCE:BANDUSDT
Support and Resistance:
SL (Stop Loss): 1.272 (0.961 USDT) – A potential level to exit if the price moves against the trade.
DCA (Dollar-Cost Averaging): 1.135 (0.925 USDT) – A level for adding to the position if the price drops.
ENTRY 1 ( 0.890 - 0.880 USDT)
TP1 (Take Profit 1):
BANDUSDT Forming Potential BreakoutBANDUSDT is currently trading within a well-defined accumulation range and is showing signs of a potential breakout from key resistance. The chart reflects a consolidation pattern with a strong support base forming near the $0.65 zone, and resistance building near the $0.80 level. With increased vol
Band Protocol Bullish · What About Bitcoin?I would like to remind you that the altcoins market is ultra bullish now. Many of the top projects are trading near support. Not at true bottom prices, the bottom is gone, but still relatively low. Soon, in a matter of weeks, everything will change and low prices will be a thing of the past.
BANDUS
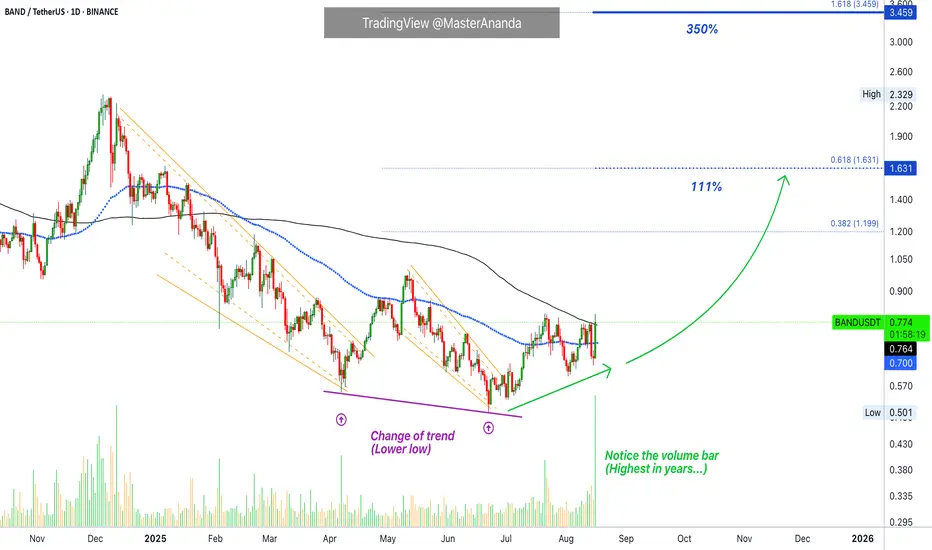
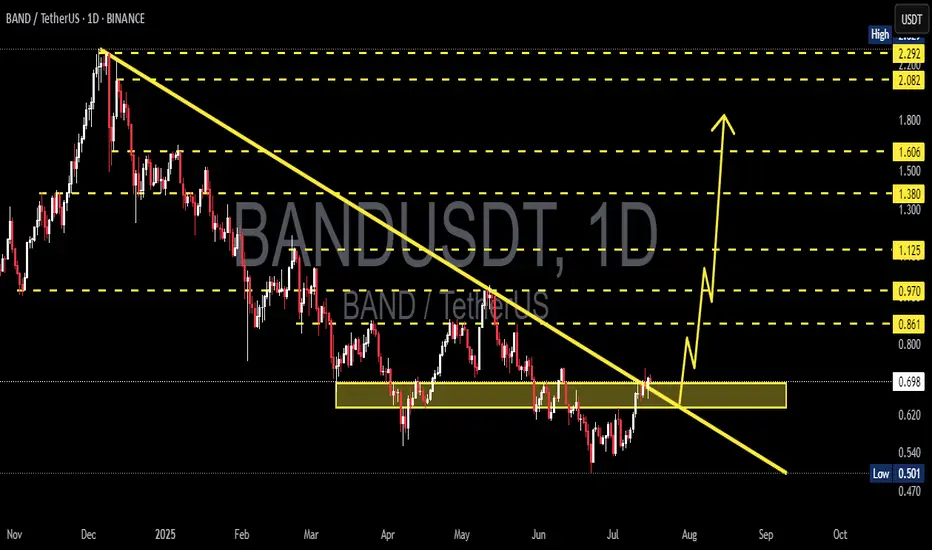
BANDUSDT 1D#BAND has broken above the descending resistance and the SMA100 on the daily chart. In case of a successful retest, the targets are:
🎯 $0.923
🎯 $1.053
🎯 $1.183
🎯 $1.369
⚠️ Always use a tight stop-loss and apply proper risk

BAND/USDT – Massive Trendline Breakout! Reversal Play!📌 Chart Overview:
BAND/USDT has officially broken out from a long-term descending trendline that has suppressed price action for over 7 months. This breakout, confirmed with a bullish daily close above a key horizontal resistance zone ($0.68–$0.70), opens the door for a powerful trend reversal.
Th
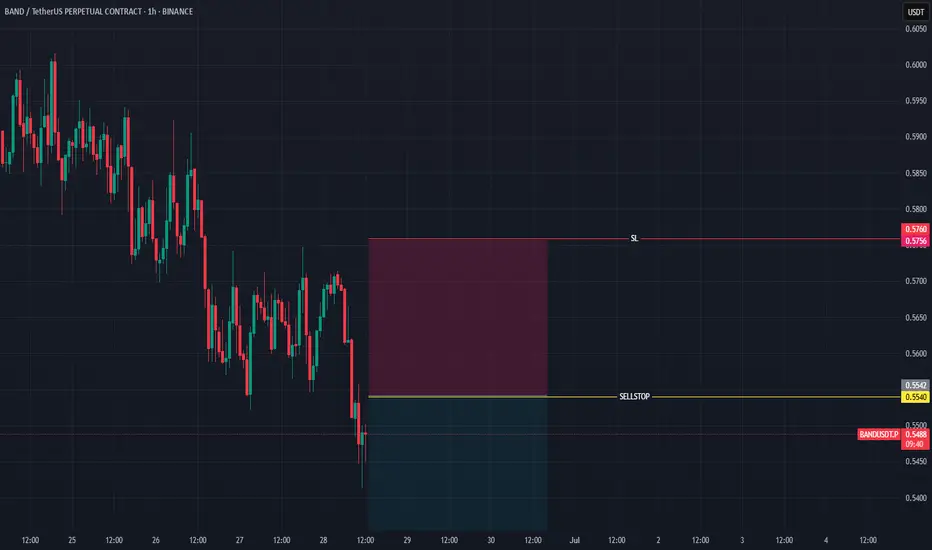
BANDUSDTBearish Trend continuation
SellStop and SL are mention on the chart
Note: Please move your SL to EP after TP1
See all ideas
Summarizing what the indicators are suggesting.
Oscillators
Neutral
SellBuy
Strong sellStrong buy
Strong sellSellNeutralBuyStrong buy
Oscillators
Neutral
SellBuy
Strong sellStrong buy
Strong sellSellNeutralBuyStrong buy
Summary
Neutral
SellBuy
Strong sellStrong buy
Strong sellSellNeutralBuyStrong buy
Summary
Neutral
SellBuy
Strong sellStrong buy
Strong sellSellNeutralBuyStrong buy
Summary
Neutral
SellBuy
Strong sellStrong buy
Strong sellSellNeutralBuyStrong buy
Moving Averages
Neutral
SellBuy
Strong sellStrong buy
Strong sellSellNeutralBuyStrong buy
Moving Averages
Neutral
SellBuy
Strong sellStrong buy
Strong sellSellNeutralBuyStrong buy
Displays a symbol's price movements over previous years to identify recurring trends.