Just thinkingCorrect me if I'm wrong this is my personal analysis on band 1 D time frame I think there's possible head and shoulder pattern in BAND chart
Trade ideas

Band expect growth of 13%The middle line of the Bollinger channel has been supporting the uptrend of the asset for a long time. an expanding wedge pattern is also formed on the chart. I expect the asset to rise to the level of 2.34-2.4. Everything else is on the chart.
This is not a financial recommendation, everything you do you do at your own peril and risk.

Band protocol in ascending channel band is ten x below ATH just like many things are we also have not made it to pre ftx levels so for now this large uptrend is in play i have marked the next targets i see
BAND/USDT perfect fib compression, heading to optimal entryPicture perfect Fibonacci compression and we're heading towards the optimal entry at 2.101.
My buy orders are in ;-)

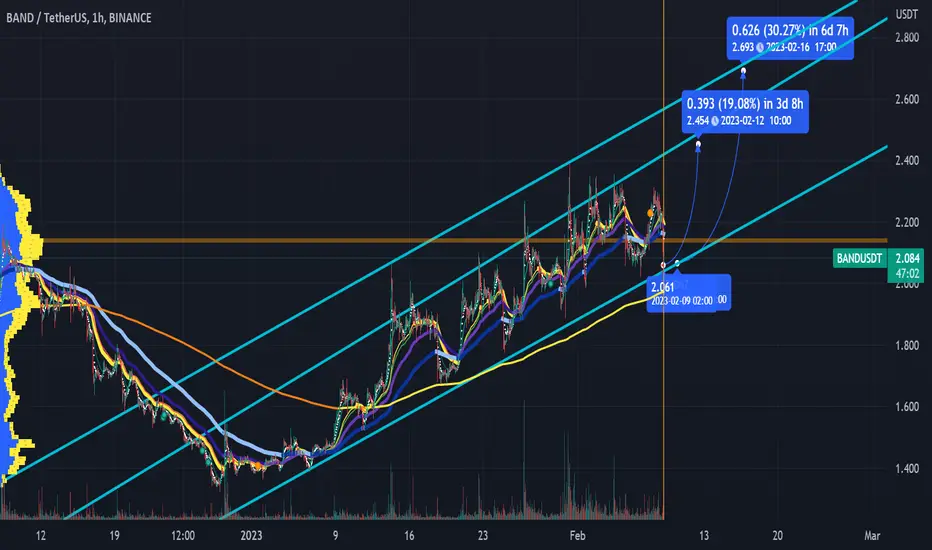
Band 2.9.21Band levels to pay attention to. If it breaks down from this potential bottom, there is a major bearish setup for Band. I do not think it does , but it does not matter what I feel. If data comes in that changes my mind we will have to set the targets to the downside. Major point of control is scary low if it does crack the 2.00 and 1.00 level. 25-30 cents there is a potential scenario where that level gets retested. Level by level though .


Band 2823A slingshot move building up in Band as it rises in this ascending channel and holding a strong bullish posture. If Band breaks the first level , It melt up like nothing you've seen since Defi Summer. Expecting a retrace up, sell off and create another macro higher low. Bull run has not started. That doesnt matter we dont need a full on bull to make money. Ride it up , take profits, get ready for the pullback but keep enough position just in case it does something its never done and just keep running to new ath

BANDUSDT 1HThe BAND on the 1H is trying to break through the cloudiness of the Ichimoku cloud and once it does it will be freer to hiss, if it pulls back it will face the MM200 at 2,160.
Supports and resistances follow.
Major support levels: 2159 / 2160 / 2080
Main Resistance Levels: 2225 / 2253 / 2326
MM200: 2,160


Band Protocol 2623The chosen oracle of 23. If Band holds here expect a large move up. I remember selling Band at 10 and 15 dollars. I cant believe I get to load up on some spot and levered positions way down at 2 dollars. Will this be our Luna of 23? Rode the Luna train from 4 to over 100 and all is documented in here.
A pullback in crypto really changes nothing and should be expected. Long term is what we are buying for

BANDUSDT is testing the resistanceBANDUSDT is currently trading at the daily resistance level, which is located at the 0.382 Fibonacci level.
The price has been trading within an ascending channel, which is a bullish pattern characterized by higher highs and higher lows.
An ascending channel suggests that the price is trending upwards and that there is a strong bullish sentiment in the market.
ONLY If the price breaks through the daily resistance level, it could indicate a potential continuation of this bullish trend.
According to Plancton's strategy , we can set a nice order
–––––
Keep in mind.
🟣 Purple structure -> Monthly structure.
🔴 Red structure -> Weekly structure.
🔵 Blue structure -> Daily structure.
🟡 Yellow structure -> 4h structure.
⚫️ black structure -> <= 1h structure.
–––––
Follow the Shrimp 🦐

Finally Band Breaks Channel Descending Channel breakout has already Confirmed
Seems Like Band Is ready For Massive bounce
Expecting 350 to 400% bulish Wave In Midterm

Parallel channel - BANDUSDT - 1H/15M - longParallel channel - BANDUSDT
Timeframe: 1h & 15m
Type: Long
Target: 2.39
BINANCE:BANDUSDT

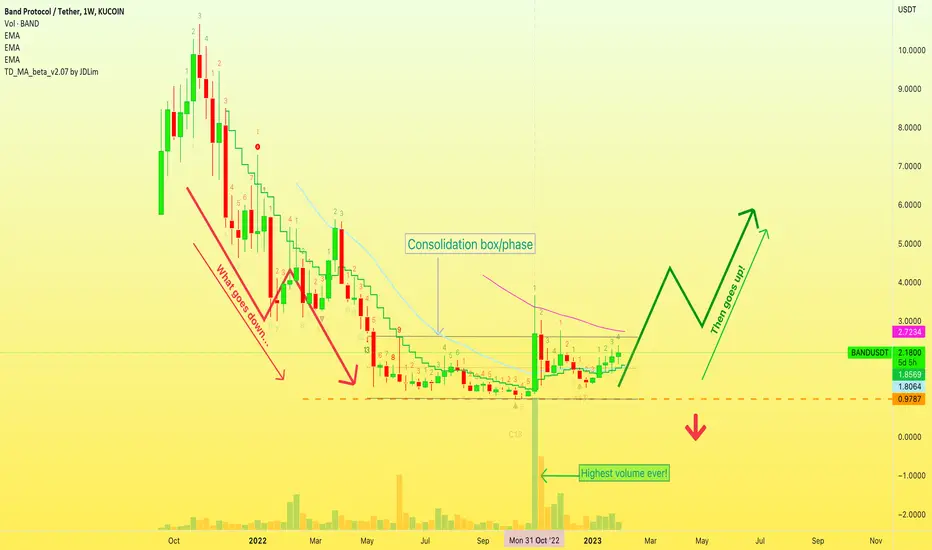
✴️ Band Protocol Rant | Volume Signal + Mirror ImageOk my friends... Are you aware that the only reason that I am writing here is to call your attention to something great that is about to happen?
Are you aware that the only reason why I am here, sharing my Soul, is so that I can call your attention to these opportunities and you can take advantage before the rest of the world does.
I do it truly because I know what it feels to be on the low end.
I also lived through this bear-market and it has been the worse.
I also know the feeling of buying early, of winning and the gratefulness that develops once we profit from our trades.
So do what you may... But consider this...
If the market doesn't turn now, it will do so in a matter of months or even weeks.
Try spot and forget margin/leverage.
Only use margin/leverage if you have been trading spot successfully for 3-5 years or, if you have a stable life and have control of your emotions.
There is a price to pay to learn.
Anyways, when trading spot the risk is so low, that if anything goes wrong in the worst case scenario any mistake can simply turn into a long-term wait.
Since we are close to the bottom, the wait can be short and after the wait comes the bullish wave.
Ok. Band Protocol (BANDUSDT).
I see this on the front page of TradingView, where it says "Community trends", so I guess you guys are looking at this.
I read hundreds of charts everyday...
And for trading, each chart should be considered separately.
But to get a feeling of the market and to know what will happen next, we have to see/read everything possible and that will give you the feeling of where we are at.
The volume signal is the strongest of all.
On the last week of October, BANDUSDT shows the highest volume ever weekly by a lot.
This tells us one thing.
For this pair, the bottom is in.
The second signal is the "mirror image".
On the left side we have a crash... What goes down...
On the right side the mirror reflects, the contrary of what we had on the left... Then goes up!
That's all my friend.
Thanks a lot for your continued support.
Namaste.
Note: This trade idea was originally published 1-Dec-2022
#Band Usdt Time Frame H1 Date (29/1/2023)#Band Usdt Time Frame H1 Date (29/1/2023)
Resistance 2.340
Support 1.883

BAND BREAKING OUTBAND has been consolidating and broke out on 4h time frame, we will see some movement to next resistance around 2.35
DYOR

BANDUSDT | BULLS IN CONTROLBAND price is showing some bull's interest by breaking the triangle and bouncing from the support.
It is currently trading near the horizontal support. If momentum starts we could see a push towards 0.618 fib level.
Manage your levels accordingly.

TReandLinE Break? BandTrendline deep search indicator shows a line that we already broke i have drawn another line in which we are at it right now so.....
the direction we go in the next few hours im not set in a specific opinion but when we do verify upside momentum i have marked the price points

Band protocol retesting trendlinewe recently had a breakout from the trendline in my previous analysis we are now retesting we need conformation of the trendline as a support a nd then aim for the targets in the linked analysis
BAND | Looks Promising for the Midterm..!!
#BAND is forming Falling Wedge in the Weekly timeframe Chart.
Seems like Bottomed out & Ready to FLY again..
Breakout is just Matter of time, Hodlers will be Rewarded..
Please like the idea for Support & Subscribe for More ideas like this and share your ideas and charts in Comments Section..!!
Thanks for Your Love & Support..!!

BAND Protocol : A Strong Daily Trend Was BrokenBAND Protocol : A Strong Daily Trend Was Broken
Like in many other currencies also on BAND Protocol the price grew more than expected.
A daily trend was broken and the price should correct more at this moment before
the next bullish move.
It could take some time in correction but it should grow again.
Targets:
🎯 2.24
🎯 2.695
Thank you and Good Luck!

BAND BUY SETUPhi, dear traders. how are you ? Today we have a viewpoint to BUY/LONG the BAND symbol.
For risk management, please don't forget stop loss and capital management
When we reach the first target, save some profit and then change the stop to entry
Comment if you have any questions
Thank You

BAND USDT SCALP SETUP WITH SL TPJUST BROKED THE 1.68 area to upside with Consolidation and high volume its good long opportunity.
