#BANDUSDT #DAILYHi guys..its the latest analysis chart OF BANDUSDT IN DAILY TIME FRAME .if you are interested any crypto that you want analyze with me and any questions please do not hesitate and comment below the chart!
BANDUSDT.P trade ideas

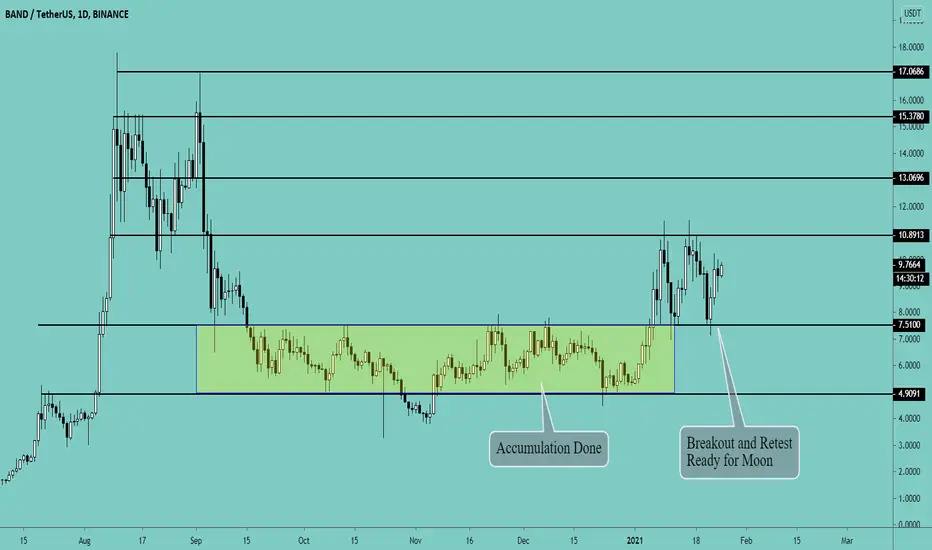
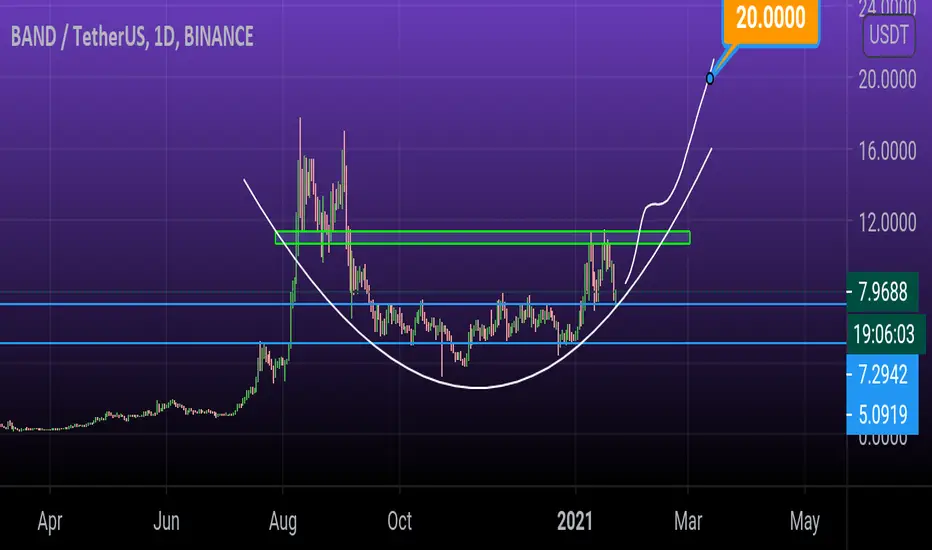
Band Protocol Ready for New All-time highBand Protocol is an Oracle + DeFi coin. Oracle coins are pumping hard with LINK and DeFi is still in trend. We expect BAND will follow LINK and DOT. There is a lot of accumulation done on BAND and now it is breaking out. The breakout is confirmed and retested in the support zone. There is only one way to go now... Moon
Buy Zone: $9.5 - $9.7 (Add more if drops to $7.5)
Target: $10.88- $12.3 - $13.06- $15.35 - $17
Band analysisMarket cap : 100 (173M$)
Transaction volume :
Ex. Flow : goes up about 1 M during 10 days (it is not for selling here because of Trading Range in lower of the channel they want to take ATH then exit)
Scan Transaction by holders: Point the most important transactions by holder on the chart that you can see the action of the price
NVT(7D) : 1.11 is acceptable
Base on this info. and chart i could say this crypto could see ATH during next month and the best buy and sell in spot market flagged on chart
If the price go out of up trend it should be reanalyzed again

BAND waiting for trendline breakout BAND / USDT
Just wait for trendline breakout before buy
1daily candel close above can add more confirmations
Good luck


#BAND/USDTPERP - Potential 20.64% #SWING
#LONG
#BAND/USDTPERP - Potential 20.64%
Entry- 9.4510
TP1- 10.2402 (75%)
TP2- 11.4018 (25%)
SL- 8.6263
- Key Notes - BTC looking like consolidation - ALT's could rally. Weekend Trading Higher risk than usual
- RR - 2.37
- Trailing Buy - 0.5%
- Trailing Profit - 1%
- Trailing Stop-Loss - No


Expecting BAND to push higherAfter retesting Fib levels on global scale and horizontal support(green) BAND has all chances to push higher after breaking current flat(orange dotted lines)

BAND/USDT - potential 68% setupHello, Traders!
After the upward movement, BAND entered the correction phase.
One of the forms of correction is consolidation.
At the moment the asset is consolidating in the range of $7.38-9.46 before the last upward surge.
Entry in the position can be considered in the range of $8.80-9.40
We would advise placing the SL under the level of $8.16 in case of high volatility
The targets are the Fibonacci retracement levels:
$10.04
$11.68
$14.02
The last target of buyers is the level of $15.49
Good luck and watch out for the market!
P.S. This is not a piece of financial advice but only trade I would be following myself


BAND like double top too muchA strong support at 7.3214. Band like to form double top too much. Let look at the triangle we have a room to go.


Double top on BAND/USDT dailyDouble top on the daily chart about to break neckline, could be a good short opportunity with stop loss above the neckline and take profits along horizontal resistances. I won't enter the trade because I'm not sure what bitcoin is doing right now, but could be a good setup if volume increases after the pullback. Confluence with daily MACD reversing. This post is mainly for me to see how it plays out later, thanks.

Band strong resistancethe uper line resistance come from 17.8 and 17 usd and its a strong resistance if Band brake this can easily touch uper price like 14 or 17

