The BAND Marches OnLet's dive right into BAND, a fascinating crypto coin that's made its mark on the one-hour timeframe. At present, the zero level of the Fibonacci sits at 0.909, while the midpoint rests at 1.004. Interestingly, the first level marks 1.049 on the charts.
The advanced Fibonacci levels, namely the 1.618 and 2.618, unveil critical areas at 1.105 and 1.195, respectively. These levels can become particularly significant in the event of a potential upside surge. They might act as formidable barriers to break, requiring substantial bullish momentum.
Meanwhile, the 50-length Exponential Moving Average (EMA) comes in at 1.029. The EMA, a powerful tool for traders, smooths out price data by continually updating an average of past prices. This level potentially indicates a robust support or resistance level, depending on the price movement.
On the Bollinger Band front, we observe the upper band at 1.114 and the lower band at 0.942, with the middle nestled at 1.028. The band's expansion and contraction can serve as a volatility indicator for BAND, signaling potentially significant price movements.
As for the relative strength index (RSI), it stands at 67. This indicator helps identify overbought or oversold conditions in a market. A level near 70 typically suggests that BAND may be becoming overbought and could be preparing for a possible price pullback.
The volume oscillator showing a negative 22 denotes decreased trading activity, which can suggest a consolidation phase or signal an impending significant move. On the other hand, the stochastic oscillator rests at 78, floating in the 'overbought' territory, possibly forewarning of a potential trend reversal.
Moving onto the On Balance Volume (OBV) indicator, we note an intriguing 96 million. The OBV essentially serves to link volume to price change, offering insights into market participants' behavior.
Next, we have the MACD, a trend-following momentum indicator, presenting a value of 0.021. The MACD is currently above the signal line, indicating bullish sentiment for BAND.
The current market price is 1.082, marking an 11% change in the last 24 hours. On a historical note, it's worth mentioning that BAND had taken a tumble from 1.196 around June 10th, 2023, plummeting to the lows of 0.943. Since then, it has been hovering around that area, but there are evident signs of an upward movement.
Now, onto the crucial part of our analysis: resistance and support levels. The price history reveals that BAND has considerable support near the 0.943 mark, a level it bounced back from after its recent dip. This area may act as a safety net, potentially curbing further price declines.
On the resistance front, the 1.196 level, representing the recent peak, can be a tough wall for BAND. Breaking past this barrier would mark a bullish victory and could open doors to higher levels.
In conclusion, BAND has been through a roller-coaster ride recently. Its current upward trajectory looks promising, but the market is still teeming with unpredictability. As always, remember to trade wisely and stay tuned for more updates on BAND's exciting journey!
Trade ideas

#BANDUSDT Shows Signs of a Potential Bullish Breakout💎 The formation of a double bottom on #BANDUSDT could be the signal bulls have been eagerly anticipating. Interestingly, we're seeing similar patterns across multiple coins recently. However, with #BAND, we're also observing how the downtrend trendline has flipped from support to resistance. It appears the price is gearing up for an upward move, targeting the previously established resistance near $1.59 (which aligns with the 38.2% Fibonacci retracement level).
💎 That said, we should also be ready for a potential minor pullback towards the $1.40 demand zone before/if #BAND embarks on an upward trend.
💎 Lastly, it's crucial for our ParadiseClub members to note that if the bulls fail to defend the double bottom, the bullish outlook is highly likely to be invalidated. Stay alert and trade safe!

BAND S&R in short term>>>>>.Hello EveryOne
I Have Tried My Best to Bring the best Possible outcome in this Chart.
Everything is cleared on the chart.
In case of more market support,pass and stablize above 1.5 in D-time frame we can entry for long position to marked supply area's.
If BAND reached that point PLZ setup your SL first(risky market)
It's just an analyze,
Not a financial advise.
PLZ DYOR
With hopping success>>>>

BAND Protocol : Don't Miss ItBAND Protocol : Don't Miss It
The price tested the support zone several times and the chances
are getting even higher that they may begin the bullish movement very soon.
Also, the lower support zone seems to be very strong.
You may find more details in the video!
Thank you and Good Luck!

BAND USDT The currency of the dog is positive, but beware of the news ..
because its rise and fall depends on the social media, and on top of them is Elon Musk

band short setup Hello Traders, here is the full analysis for this pair, let me know in the comment section below if you have any questions, the entry will be taken only if all rules of the strategies will be satisfied. I suggest you keep this pair on your watchlist and see if the rules of your strategy are satisfied. Please also refer to the Important Risk Notice linked below.
Entry: 1.699
Profit: 0.993 (41.55%)
Stop: 1.873 (10.24%)
Risk-To-Reward: 4.06

$band diamond pattern and it's swept the march lowsNASDAQ:BAND diamond pattern and it's swept the march lows, could pump some along with NASDAQ:LINK that is famously dead for the past year or so.

band long 5x 1-band/btc is on macro support
2-band usdt is on support of triangle pattern with easy invalidation
3-i am target top of triangle and then evaulate if their is breakout

BAND/USDT WTFSharing with your weekly time frame (WTF) on this prospective active.
If the current market buying power will stay on, and in case BAND/USDT will break 1.22 price up, then the price might rise to 3 USDT.
Currently we are under middle line of the global straight channel, and could not break 1.22 for days already.
Current analysis is only for study purposes, not a financial advice. Study, before any words and actions.

Something to lookWhat do you think of my Analysis?
Its a good thing to buy small if you arent sure.
Trade Responsibly.

Breakout the massive falling wedge🔸As u see in weekly chart ... The massive falling wedge since 30 months has successfully breaking out and now retest.
🔸Iam waiting for this retest and weekly close above 0.382fib level
🔸My target would be 5$
Dont forget to support us with ur like, comment and follow for more ideas and updates.🎯

Band Looks Ready To Recapture 10$Seems Like Band Is Ready To Move towards 10$
Descending Channel + Symmetrical Triangle Breakout Has Already Confirmed Expecting Decent Recovery Towards 10$ In Coming Weeks


BANDUSDT - big move incoming2-week chart looks very juicy, I have seen this RSI pattern many times before and I know what comes next. 10x long

Band 100% Bullish Move Loading Bandusdt
Band Usdt Symmetrical Triangle Pattern Breakout Already Confirmed on 4h timeframe
Higher time-frame descending channel breakout & retest already done
Expecting 100-300% Bullish Move Incoming Days
Manage risk & do your own research
If you are satisfied with our work join

Home work EWThe goal here is to chart Elliot waves and each wave has to be correlated with MA crosses. In addition the fibb retracement is used to confirm the corrections and reversals.

BANDUSDT signallong
lev 7
stop 1.755
we have nice trendline on 1.7344,1.7701,1.7955 ,1.8255 wich is really powerfull and we can see chart reactions to our trend line
1.8204 and 1.7944 can be good entry.
don`t forget risk management

BAND looks ready (30 % pump)BAND looks like it's ready to make a move.
The price has been respecting the upsloping support line and currently is below the horizontal resistance. Once it breaks the resistance, we should see an explosion to the upside.
30 % move likely.
Enter long at the breakout or once the price consolidate above the horizontal resistance and back test it as a support.
Good luck

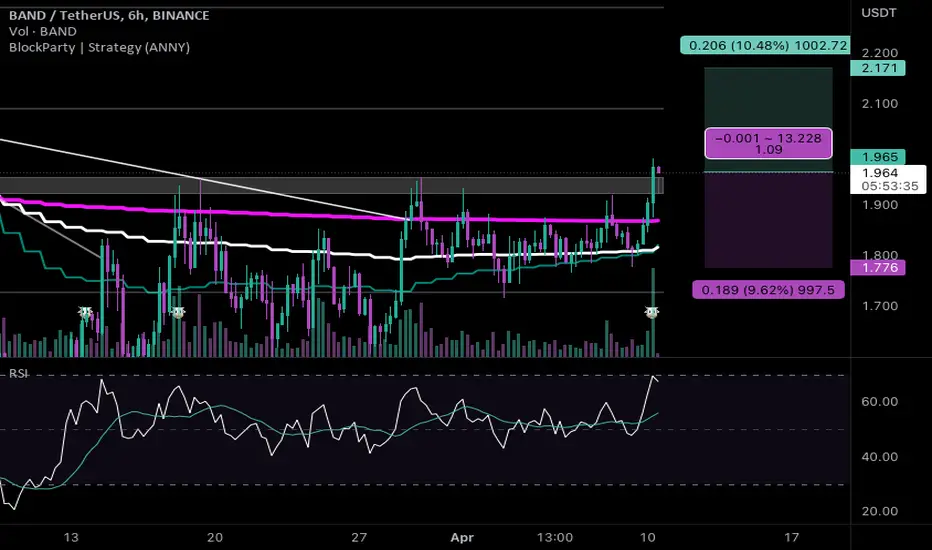
#BAND/USDT - Long - Potential Direction: Long
Market: Spot
Risk: 0.25% - 1%
#USDT_BAND
Exchange: BINANCE
Timeframe: 360
TP1: 2.171
Entry: 1.974
STOP: 1.777
Entry Conditions:
| Overhead resistance Break
| Fast/Mid/Slow MA break
| Big volume
BANDUSD RANGING WITHIN A TRIANGLEThis asset has been within A TRIANGLE. This asset is likely to break out in either directions.
Monitor for possible breakout and a run thereafter.

BAND ... Band ... ready to jump !
By considering risk management, you can get a good profit from BAND in short & mid-term ...
>>>>>>>> DYOR
Good luck ;)

BANDUSDT 1,2,3 - ignition...BAND is standing at the support, which should provide some buying pressure very soon. If the price remains above the support, we would expect a rally.

