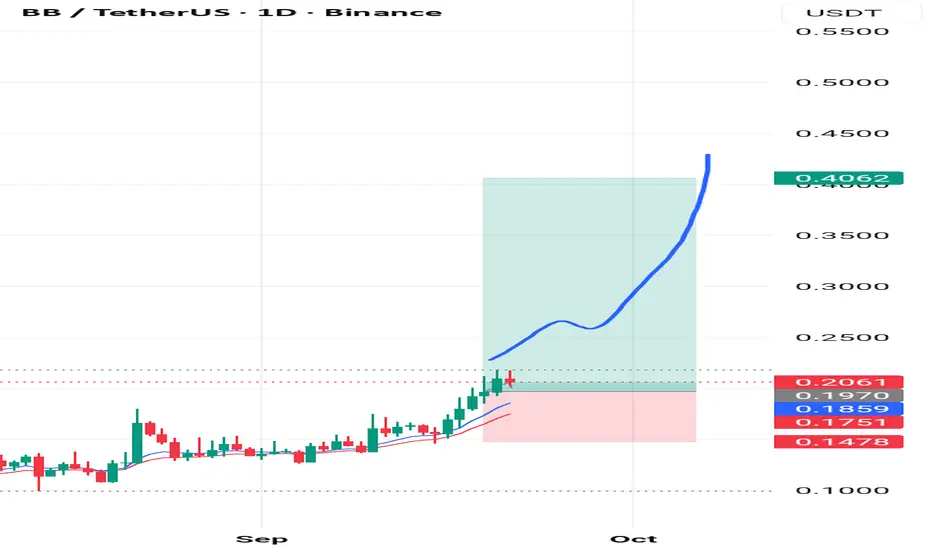
BBUSDT ANALYSIS #BBUSDT looks promising for a spot buy with potential for 2x-3x gains in 3-4 weeks. A breakout above $0.23 could push the price towards $0.40 , $0.60 and. Manage your risk
BB has formed a double TOP📊 NYSE:BB Market Update
NYSE:BB has formed a double bottom but then broke below the support level 🔵❌. This signals potential downward movement if buyers don’t step back in. ⚠️

BBUSDT Forming Bullish WaveBBUSDT is showing a powerful bullish wave pattern, which often signals the start of a strong upward momentum phase. The price structure suggests that buyers are steadily gaining control, pushing the market toward higher resistance zones. With good trading volume supporting this move, the setup looks

BBUSDT (Bouncebit) Spot Buy Bought BB spot due to weekly obv breakout and close to 100m volume and only a 165m marketcap. Can see this pumping after all the new liquidity entering due to Asters rise.

BB ANALYSIS🔆#BB Analysis : Channel Following ⛔️⛔️
As we can see that #BB is following ascending channel on daily time frame. We can see a bullish formation here. And if it trade with good volume then we can see a proper bullish move in #BB 📈📈

One Push Away From Lift-Off, BB Breakout Setup$BB/USDT is right at a crucial confluence zone where the downtrend resistance and horizontal supply overlap. Buyers have been pushing price higher, but this area is acting as a real test.
If BB manages to break and close above this zone with strength, it could fuel a strong rally as momentum shifts

BBUSDT Forming Bullish MomentumBBUSDT is currently displaying a bullish setup as it forms a falling wedge pattern, a classic reversal structure that often precedes significant upward momentum. This formation, coupled with strong buying interest, suggests that the market could be preparing for a major breakout move. With volume sh

BBUSDT Forming Bullish PennantBBUSDT is currently shaping a bullish pennant pattern, which is often viewed as a continuation signal after a strong upward move. This formation usually reflects a period of consolidation before price resumes its upward trajectory. With good trading volume confirming market participation, the potent

BBUSDT UPDATE#BB
UPDATE
BB Technical Setup
Pattern : Bullish Falling Wedge pattern
Current Price: $0.1603
Target Price: $0.3359
Target % Gain: 120%
Technical Analysis: BB has broken out of a falling wedge on the 1D chart with strong momentum. The breakout candle closed above resistance with good volume, sign

$BB 4H: Explosive Breakout & Profit Targets Revealed!BINANCE:BBUSDT
🚀 NYSE:BB 4H: Explosive Breakout & Profit Targets Revealed! 📈
Prices and Key Levels:
Entry: 1 - 0.1770 & 0.1780 (recommended zone for market entry).
TP1 (Take Profit 1): 0.7860 - 0.1604 (first profit target level).
TP2: 0.6180 - 0.1473 (second profit target level).
TP3: 0.5000 -

See all ideas
Summarizing what the indicators are suggesting.
Oscillators
Neutral
SellBuy
Strong sellStrong buy
Strong sellSellNeutralBuyStrong buy
Oscillators
Neutral
SellBuy
Strong sellStrong buy
Strong sellSellNeutralBuyStrong buy
Summary
Neutral
SellBuy
Strong sellStrong buy
Strong sellSellNeutralBuyStrong buy
Summary
Neutral
SellBuy
Strong sellStrong buy
Strong sellSellNeutralBuyStrong buy
Summary
Neutral
SellBuy
Strong sellStrong buy
Strong sellSellNeutralBuyStrong buy
Moving Averages
Neutral
SellBuy
Strong sellStrong buy
Strong sellSellNeutralBuyStrong buy
Moving Averages
Neutral
SellBuy
Strong sellStrong buy
Strong sellSellNeutralBuyStrong buy
Displays a symbol's price movements over previous years to identify recurring trends.