Amd - This stock is just crashing!🎯Amd ( NASDAQ:AMD ) is clearly heading lower:
🔎Analysis summary:
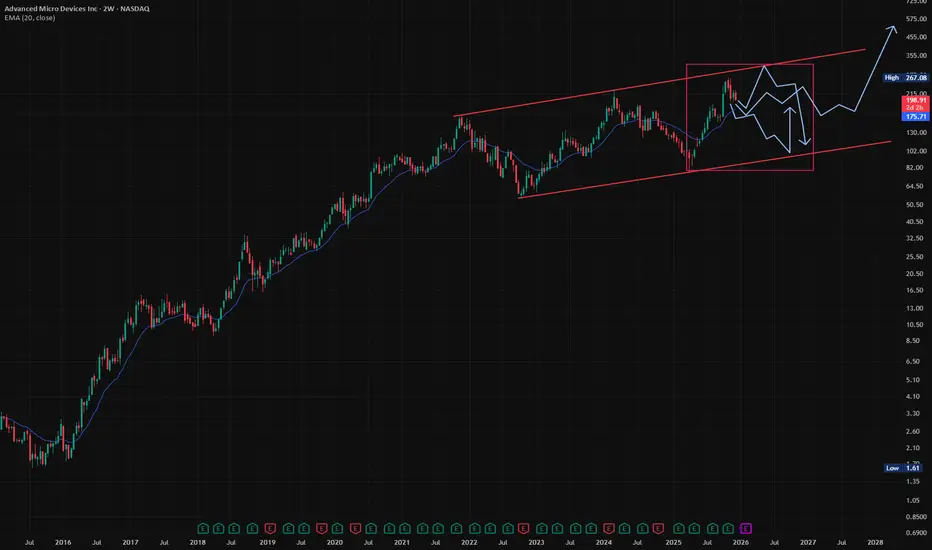
After we witnessed a major bullish break and retest in April of 2025, Amd rallied about +150%. But with the recent rejection at the major resistance trendline, Amd is now reversing. Following this bearish market structure, Amd can still correct about -25%.
📝Levels to watch:
$150
SwingTraderPhil
SwingTrading.Simplified. | Investing.Simplified. | #LONGTERMVISION
Advanced Micro Devices, Inc. Shs Cert Deposito Arg Repr 0.1 Shs
No trades
Market insights

double ascending channelAMD is trading in an ascending channel on both the weekly and the dayli chart.
the dayli chart shows we are at support but the weekly chart shows we just hit resistance and could face alot downside.
if AMD manages to reach above $227 resistance zone we wil probally move back to ath to see a double top there.
if you are still holding AMD like i am.
i suggest you to get out if it hits $266 again. theres no way we are going to break the weekly channel to the upside.

$AMD 2026 outlook: Expect wide range-bound action, especially H1NASDAQ:AMD - Not in position (on request).
Fundamentals: Data center growth solid but competition intensifying ( NASDAQ:NVDA AI dominance, NASDAQ:INTC fighting back). Margins under pressure as hyperscalers negotiate harder. 2025 guidance likely conservative.
Technicals: 150x move since 2016 puts us in rarified air. Channel structure suggests we're entering consolidation/normalization phase.
2026 outlook: Expect wide range-bound action, especially H1. Big down, big up structure typically precedes extended base-building.
Channel could extend years. Overextension possible, but probability favors digestion here.
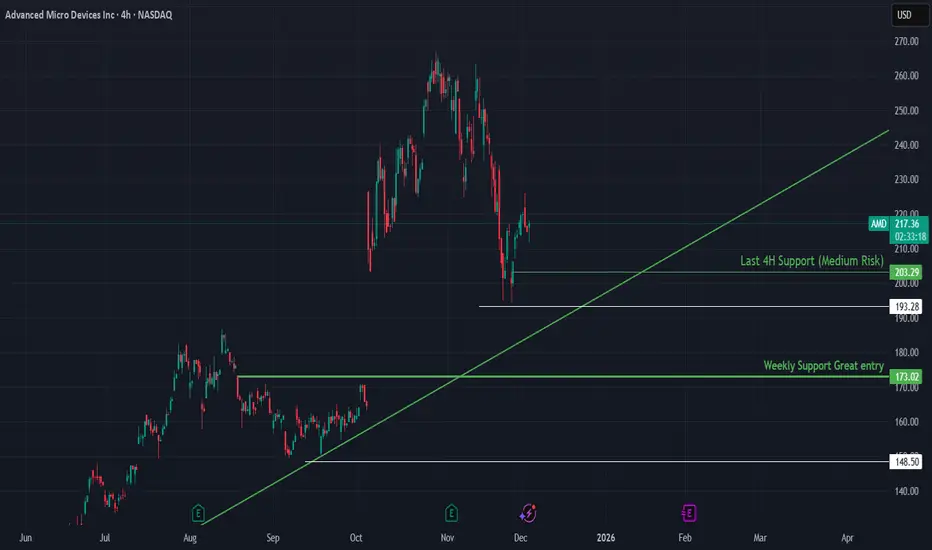
(AMD) – Key 4H Support Levels & Trend Structure OutlookAMD is attempting to stabilize after a strong corrective move from its recent highs. Price has formed a short-term rebound, but remains below local resistance levels. The chart shows two major support structures: a 4H support at $203.29 and a deeper weekly support at $173.02, which stands out as the highest-value entry zone. As long as the broader uptrend structure holds, AMD retains a constructive bias.
🔍 Technical Analysis
Current Price: ~$217.82
Recent price action highlights:
AMD is attempting to build a base after a sharp pullback.
The last 4H support at $203.29 is the nearest active demand zone (medium-risk).
A deeper pullback would bring price into the weekly support at $173.02, which is a highly attractive long-term entry zone.
The ascending trendline from the September/October base remains intact, supporting the medium-term bullish bias.
Structure:
Short-term volatility within a broader uptrend, with two clean support zones stacked below current price.
🛡️ Support Zones (if pullback continues)
🟢 $203.29 (4H Support – Medium Risk)
▫️ Stop-loss (White Line): $193.28
Nearest active demand, suitable for shorter-term traders.
🟢 $173.02 (Weekly Support – Great Entry)
▫️ Stop-loss (White Line): $148.50
Major weekly structure, excellent swing entry if reached.
🧭 Outlook
There are several valid approaches depending on trading style:
1️⃣ Enter near the 4H support at $203.29
This is the closest support and a decent medium-risk entry for traders looking to position early.
However, it is not the strongest structural level on the chart.
2️⃣ Wait for the weekly support at $173.02
This is the best value zone and offers the highest reward relative to risk.
Ideal for swing traders seeking a cleaner setup.
Bias:
Constructive while AMD trades above $203, strongly bullish if the weekly $173 zone is reached and holds.
🌍 Fundamental Insight
AMD continues to expand its presence in high-performance computing, AI accelerators, and data center GPU markets. With increasing competition in AI chips, AMD’s MI300 lineup has gained early traction, while strong consumer CPU sales and expanding cloud partnerships support long-term fundamentals.
Short-term volatility reflects broader tech market conditions more than AMD-specific weakness.
✅ Conclusion
AMD is showing early signs of stabilization, but the strongest bullish opportunities lie at the $203 4H support and especially the $173 weekly support.
These levels offer clean risk–reward setups depending on the trader’s style, while the broader trend remains intact.
If you found this useful, don’t forget to like & follow for more structure-based insights.
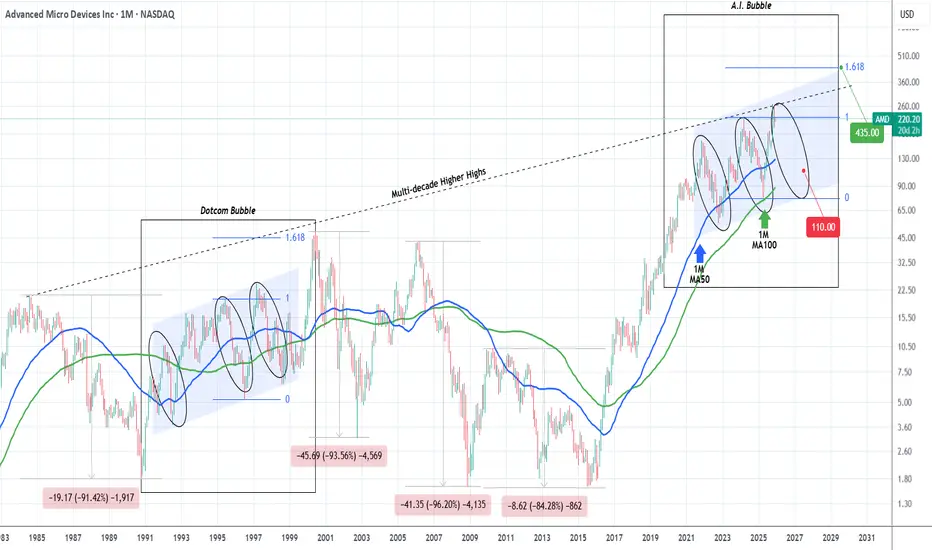
AMD started the A.I. Bubble's final Bear Cycle.2.5 months ago (October 27, see chart below), we gave a bold sell signal on Advanced Micro Devices (AMD), which at the time was against the prevailing bullish market sentiment but started to pay off immediately as the market topped and got rejected:
We still view that Top as the Higher High of its 6-year Channel Up, hence expecting the rejection to evolve into a technical Bearish Leg (Bear Cycle), targeting $110.00.
On today's analysis, we take the long-term horizon a step further as we go back to 1984 and the start of AMD's multi-decade Higher Highs trend-line, a Resistance level that has historically pushed the stock to its key market Tops.
On this 1M time-frame, we have pointed out the Dotcom (Internet) Bubble comparing it with the current A.I. Bubble. As you can see there are strong similarities between the two eras and more specifically the symmetry among their Bullish and Bearish Legs. As mentioned on the previous analysis, the current fractal has technically topped, and is now starting the new Bearish Leg towards $110 and the 1M MA100 (green trend-line).
During the Dotcom Bubble when that corresponding final Bearish Leg was completed, the market started is final parabolic rally that peaked marginally above the 1.618 Fibonacci extension and the Bubble burst.
For investors that have a long-term multi-year horizon, that translates for the A.I. Bubble into a $435 Target by 2030.
---
** Please LIKE 👍, FOLLOW ✅, SHARE 🙌 and COMMENT ✍ if you enjoy this idea! Also share your ideas and charts in the comments section below! This is best way to keep it relevant, support us, keep the content here free and allow the idea to reach as many people as possible. **
---
💸💸💸💸💸💸
👇 👇 👇 👇 👇 👇
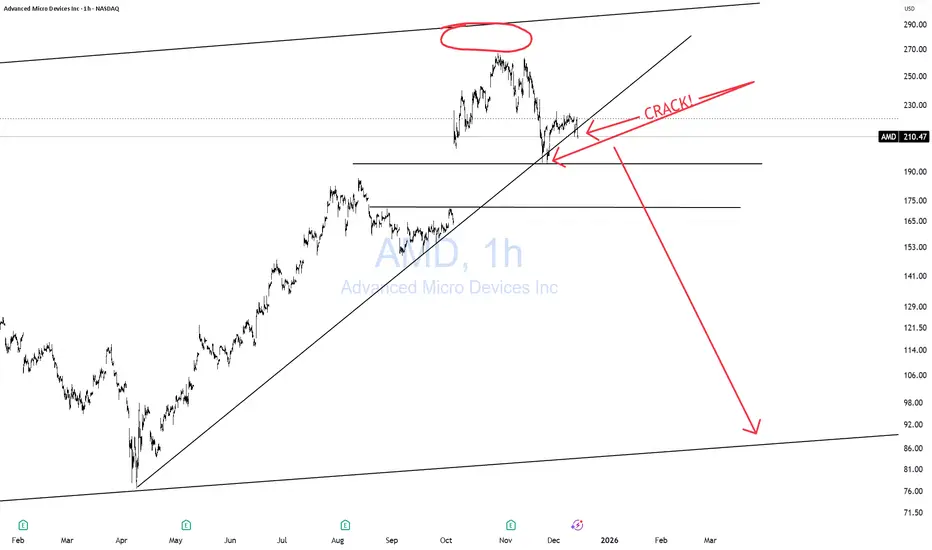
AMD CARCKSSSSAMD has multiple cracks in the uptrend
A big, subtle but powerful void in its last attempt to high the upper trendline. Which is more telling of weaness.
A BIG ARS gap below it.
AMD has already lost -22% from its all-time highs. Likely to lose a lot more.
As I have been warning (GTFO & STFO) here for a while, about the entire market.
CAUTION to the permabulls "Buy The Dip" who have no exit strategy. Remember, no matter where the price goes, it's always 100% from zero! You can't "buy the DIP" unless you "SELL the RIP! That's just simple counting. Nothing Fancy!
THANK YOU for getting me to 5,000 followers! 🙏🔥
Let’s keep climbing.
If you enjoy the work:
👉 Drop a solid comment
Let’s push it to 6,000 and keep building a community grounded in truth, not hype.
AMD Hull MA Pullback: Strong Upside Projection Ahead!🔥 AMD Profit Playbook — Hull MA Pullback Power Move 🔥
Asset: AMD – Advanced Micro Devices Inc.
Market: NASDAQ
Style: Day/Swing Trade Profit Playbook
📈 Trade Thesis
The bullish structure stays intact with a clean HULL Moving Average pullback confirming continued upside momentum. The flow remains constructive as long as price respects trend behavior and avoids deep retracements.
🎯 Entry Plan
You can enter at any valid price zone based on your personal system, confirmation signals, or preferred demand levels. Traders use different timing tools — choose what aligns with your process. ⚙️📊
🛑 Stop Loss Zone
SL: 160.00
This is the “Thief SL” level — tight, sharp, and designed for aggressive traders only.
Note: Dear Ladies & Gentlemen (Thief OG’s), this is not a mandatory SL. Choose your own SL based on your risk appetite. Your money = your responsibility. Stay smart, stay safe. 💼⚠️
🎯 Take Profit Targets
Target 1 → 236.00
📌 Strong resistance + trap + liquidity pocket — smart place to escape with clean profits.
Target 2 → 260.00
📌 Heavy resistance + overbought zone + trap formation — high-reaction level, so secure profits before the crowd reacts.
Note: Dear Ladies & Gentlemen (Thief OG’s), TPs are guidance only. You decide your exits. You make money → you take money at your own risk. 💸🫡
👀 Related Pairs to Watch (Correlated / Sector Influence)
These tickers often react together due to semiconductor sector rotation, AI-demand cycles, and ETF weightings:
NASDAQ:NVDA
– Direct peer. Moves with AI spending cycles. Large swings can influence AMD sentiment.
NASDAQ:SMH (VanEck Semiconductor ETF)
– Sector trend indicator. If SMH pumps, AMD usually follows.
NASDAQ:SOXX (iShares Semiconductor ETF)
– Broad chip-market strength gauge. Market-wide chip themes impact AMD direction.
NASDAQ:QCOM
– Tech-chip correlation, especially during macro chip-cycle expansions.
NYSE:TSM
– Manufacturing leader. Capacity signals often impact AMD pricing expectations.
Watching these pairs helps you gauge risk-on/off behavior across semiconductors and improves timing on AMD entries/exits. ⚡📊
📘 Final Notes
This setup is crafted for fun with a “thief-style trading twist”, but still aligned with proper technical structure and TradingView’s rules.
Nothing here is a financial recommendation — just pure charting vibes, strategy style, and technical storytelling. 🎨📉📈
✨ “If you find value in my analysis, a 👍 and 🚀 boost is much appreciated — it helps me share more setups with the community!”
Disclaimer:
This is thief-style trading strategy just for fun. Not financial advice. Trade responsibly.
#AMD #NASDAQ #SwingTrade #DayTrade #HULLMA #BullishSetup #LiquidityZones #Semiconductors #SMH #SOXX #NVDA #TSLAstyleCharts #PriceAction #TechnicalAnalysis #ThiefStyleTrader 🚀🔥

AMD OutlookHere it goes.
Yes, some of yall might see this and say "uh yeah crazy analysis, you just drawn up all the possible scenarios" since all the market can do is go up, down or consolidate.
Well, no.
This is about expected behaviour and bias.
As long as we are inside the top box, following the yellow line I'd trade rotations from the extremes.
If we break below, following the red line , I'd expect our next stop to be between 152-174.
This is where I would fill spot bags, get calls, whatever. It's a great zone for accumulation.
If we break, following the green line , above I'd continue to be long. Keep an eye on the macro-economics. Especially deals with China and the further progression of Companies like Moore Threads pose a threat to NASDAQ:NVDA and AMD.
Same with the TPUs from $GOOG.
Anyways, that's just my two cents.
Happy Trading.

The Top 3 Strategies To Find Stocks To Buyi feel so happy because i am about
to start my online business journey
and finally get to live on my own outside
the guidance of my parents,relatives
and friends.
This means i am about to find financial independence.
At the same time i have mastered how
to trade stocks, forex, and crypto.
I remember talking about how frustrated i am
with my life, that i was ready to get a job at
the fast food restaurant
But i have not given up on my
business man dreams.
Trading is just like a business
its not enough to learn the technical
you need to study business strategy
By W.Chan and Renee the book
is called blue ocean strategy
Inside this book i learnt the
art of elimination in
business strategy,
This is what helped me find a
strategy for trading
that is both powerful
and follows risk management.
Based on my stock trading system
i used the following to find
these stocks:
-The 50 EMA
-The 200 EMA
-Chart patterns such as - Ascending Triangle
50 EMA > Chart pattern < 200 EMA
I placed the chart pattern
between the two EMA's
and then i found the best one
based on risk
management i used the Stochastic+RSI
making sure the price is below the 50 RSI.
This gives me a place to stop buying.
I make sure both the %k and %d are
below the 50 line.
Trade safe and never ever give up
on your trading journey
keep learning and growing.
Rocket boost this content to learn more.
Disclaimer: Trading is risky please use a simulation trading account
and learn risk management and profit taking
strategies before you trade with real money.

Quant Signals V3 | High-Conviction AMD Setup RevealedInstrument: AMD
Signal Type: Weekly Trade
Direction: BUY CALLS
Confidence: Medium (62–65%)
Strike Focus: $222.50 – $225.00
Entry Price: $3.85 – $5.00
Target 1: $6.16 – $7.38 (≈50% gain)
Target 2: $8.58 – $9.84 (≈100–120% gain)
Stop Loss: $2.70 – $3.69
Expiry: 3–4 days (2025-12-12)
Position Size: 2% of portfolio (reduced due to Katy conflict)
Weekly Momentum: Neutral (-0.13% – -0.29%)
Options Flow: Extremely bullish (PCR 0.38, institutional call buying)
News Catalyst: Presidential endorsement boosting short-term bullish momentum
Risk Level: High – conflicting signals (Katy AI bearish vs. strong news/options flow)
Notes:
Conflicting signals require conservative sizing and tight stops
Monitor VWAP $218–$219; breaking below may invalidate upside thesis
High volatility expected; position accordingly
AMD SwingReasoning:
Strong Industry/Sector
50MA Pullback
If Labelled a Swing trade(2-6 Week Holds)
Entry: Full position on breakout
Profit Taking: Sell 1/3 at Goal 1
Final Exit: Remainder at Goal 2
If labelled a long term trade (3-12 Month Holds)
Entry: Full position on breakout
Profit Taking: Sell 1/4 to 1/5 at Goal 1
Exit Signal: Close below 20-day EMA (your trend guide) or 50EMA
Why: Strong moves are hard to time at the top, but the 20EMA acts as a reliable trend filter
Note:
Remember: Every long-term investment alert can also be played as a swing trade.
I normally use half the risk that I show here, this is because I am okay re-entering if it fails and it gives a better R/R ratio

AMD - Returning Red LogoAMD has resumed its downward move, hence the “red” color and old logo feel more relevant than ever.
Wave analysis suggests further decline, with primary targets around 170 , then 155 , or somewhere in between.
---
Please subscribe and leave a comment.
You’ll get new information faster than anyone else.
---

$AMD LONGWill only be looking for longs below $200 , and a bullish divergence. So for now will be playing puts till my long bias confirmation

Potential to hit 100s after a bull runIt has struggled since its breakout this past summer. Still showing signs of slowing down, and could ease of the gas during the end of year without too much more of a sell off.

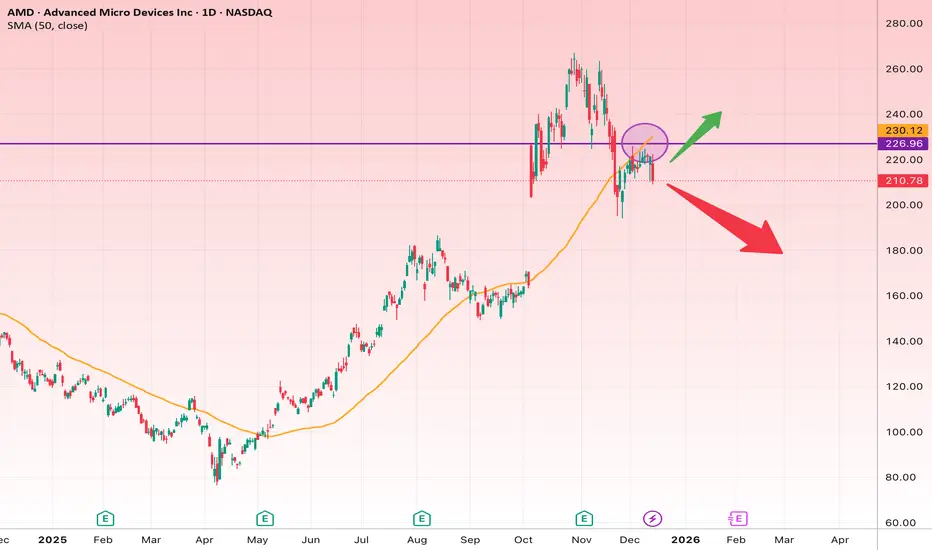
AMD Technical Analysis (Daily Timeframe)After a strong bullish impulse, AMD has entered a corrective phase and is currently trading below the 50-day SMA (around 230) and under a key horizontal resistance zone at 226–230.
The circled area highlights a clear rejection from resistance combined with the SMA, making this zone critical for the next directional move.
Bullish Scenario
If price achieves a daily close above 230:
Targets
• Target 1: 245
• Target 2: 260
• Target 3: 275–280
Stop Loss
• Daily close below 218
Rationale :
Breakout above a major resistance and reclaiming the 50 SMA would signal trend continuation and renewed bullish momentum.
Bearish Scenario
If price loses the 205–210 support zone:
Targets
• Target 1: 195
• Target 2: 180
• Target 3: 165
Stop Loss
• Reclaim and daily close above 225
Rationale:
Repeated rejection from resistance, weakening momentum, and a deeper correction following an extended rally.
Very Short Summary
Above 230 → Bullish continuation
Below 210 → Deeper correction likely
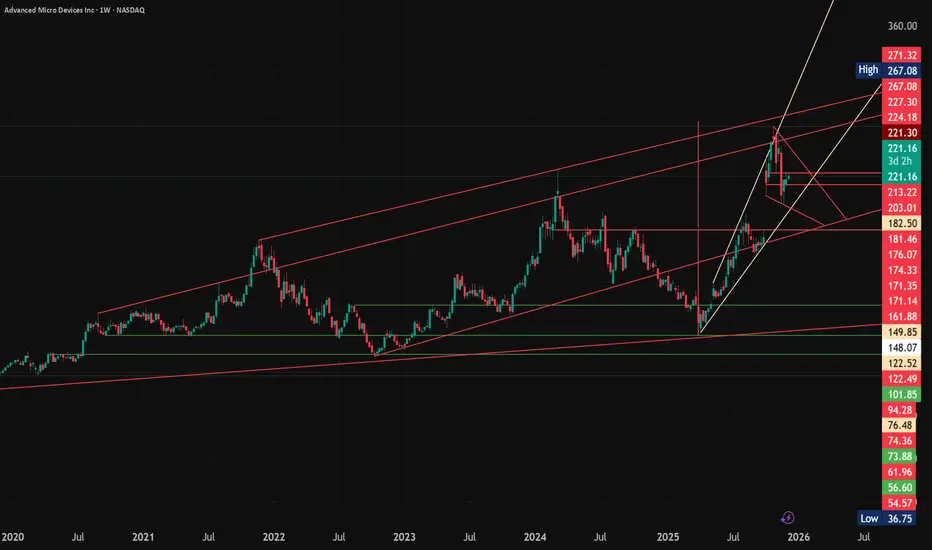
AMD Weekly – Bullish SetupPrice is still respecting the long-term rising channel.
A weekly close above 221–224 strengthens bullish continuation.
Primary Targets:
• 230
• 244
• 267
• Extended Target: 300 zone (premium band of the channel)
Stops:
• Aggressive: 213
• Conservative: 203–205
• Invalidation: Below 182
AMD Weekly Forecast: Bearish Katy Prediction Overrides Bullish F📉 AMD — PUT Signal (High-Conflict Bearish Play) Date: 2025-12-08
Katy AI shows a clear bearish trajectory despite bullish weekly momentum and bullish options flow.
🎯 PUT Trade Setup
Direction: PUT
Strike: $220P
Entry: $0.45 – $0.47
Target 1: $0.90
Target 2: $1.35
Stop Loss: $0.23
Expiry: 2025-12-12 (4 days)
Position Size: 2% (high risk)
🧠 Why PUT?
Katy AI Prediction
Predicts drop toward $217.47 (-2.48%)
Extends to $216.03 (-3.13%) by Tuesday
168-point projection = consistent downside path
Technical Signals
RSI 77.9 (overbought) → reversal risk
Price $223 above VWAP → divergence
Resistance $224.17 is holding
Support $214.14 → room to fall
Flow Sentiment
Options flow very bullish (PCR 0.38)
But Katy bearish → contrarian put setup
⚠️ Risk Warning
HIGH RISK setup due to LLM vs Katy conflict
Fast exit required if bullish flow accelerates
Strict stop loss recommended

AMD Weekly Put Setup – Bearish Momentum with Katy AI InsightInstrument: AMD
Direction: Buy Puts (Short)
Strike: $210.00
Entry Price: $2.96
Profit Target 1: $4.41
Profit Target 2: $5.88
Stop Loss: $2.21
Expiry: 7-day horizon (2025-12-12)
Position Size: 2% of portfolio
Confidence: 65%
Risk Level: Moderate-High due to weekly expiration and China policy uncertainty
Analysis Summary:
Katy AI predicts a sustained bearish move from $217.90 to $214.31 by Friday.
Weekly momentum is bearish (-2.07%), price below VWAP, resistance at $220, support at $215.
Political catalysts: US-China AI chip restrictions increase downside risk.
Options Flow neutral (PCR 0.98) but unusual activity at $180 puts signals institutional hedging.
Gamma risk moderate; Friday expiration requires careful monitoring.
Edge & Strategy:
Trade leverages bearish AI prediction and geopolitical catalysts.
Conservative delta selection (-0.287) balances probability and premium cost.
Recommended to exit at Target 1 for a 50% gain due to short weekly horizon.
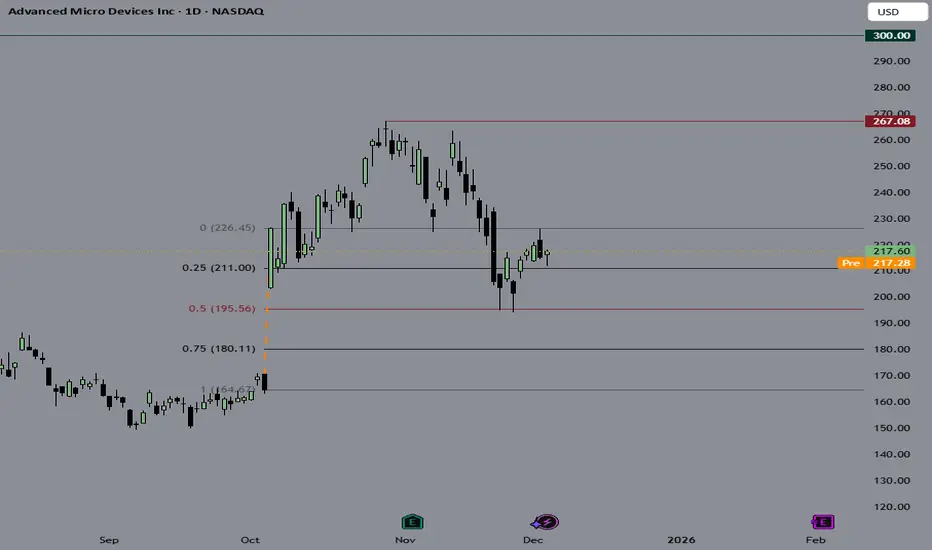
AMD — [2D] WEEK 49 TREND REPORT | 12/04/2025AMD — WEEK 49 TREND REPORT | 12/04/2025
Ticker: NASDAQ:AMD
Timeframe: 2D
This is a reactive structural classification of AMD based on the weekly chart as of this timestamp. Price conditions are evaluated as they stand — nothing here is predictive or forward-assumptive.
⸻
1) Current Trend Condition [ Numbers to Watch ]
Current Price @ 217.20$
• Trend Duration : +27 Days (Bearish)
• Trend Reversal Level ( Bullish ): 226.29$
• Trend Reversal Level ( Bearish Confirmation ): 210.93$
• Pullback Support : 226.29$
• Correction Support : 194.27$
• Structural Support : 149.29$
⸻
2) Structure Health
• Retracement Phase:
Correction (approaching 61.8%)
• Position Status:
Caution (interacting with structural layers)
⸻
3) Temperature :
Neutral Phase
⸻
4) Momentum :
Coiling
⸻
Methodology Overview
This classification framework evaluates directional conditions using internal trend-interpretation logic that references price behavior relative to its structural layers. These relationships are used to identify when price movement aligns with the framework’s criteria for directional phases, transition points, or regime shifts. Visual elements or structural labels reflect these internal interpretations, rather than explicit trading signals or preset indicator crossovers. This framework is observational only and does not imply future outcomes.

Upvote to Spread This AMD AnalysisI’ve been building this position since AMD was in the $90 range, and I’m continuing to establish exposure because the risk reward is still favorable.
They’re finally converting AI demand into real deployments. Hyperscalers are adopting AMD as the primary alternative to NVIDIA, and AMD has a history of competing effectively when the market underestimates them. This AI cycle is setting up the same way.
The valuation gap between AMD and NVIDIA remains historically wide. I don’t need AMD to match NVIDIA partial convergence over the next 12–24 months is enough to unlock meaningful upside.
Fundamentals are trending in the right direction:
• Data center growth accelerating
• Client and gaming segments already bottomed
• Leadership executing with consistency
This is a positioning trade, not momentum. I’m allocating ahead of broader recognition, the same framework that’s worked for my previous setups.
If you’ve been following my work, an upvote pushes this analysis to more people.
Amd weekly chart
After AMD successfully broke above the level of $131.71 and closed above this level with a weekly candle, the stock began a rally until it reached the overbought level of 70 on the RSI.
Now I feel afraid. I think it’s time to take profits and exit.
Good luck 4all 🃏

"Bullish Continuation Candle On The 4H Or 1H Chart To Enter"Its not easy to walk the line between fear and freedom.
They are very similar i want you to be bold
even if you lose
I want you to get back up and fight again.
I want you to never give up on learning
Below is a complete breakdown as to why this is a good buy signal.
This analysis is very deep and i want you
to re read it again and study it carefully
Trade safe:
Re-Evaluation: Why This is Now a High-Probability Buy
The addition of the price being above both the 50 and 200 EMA on the daily chart is a game-changer. It transforms the picture:
Defines the Bullish Structure: Trading above both the 50 (medium-term) and 200 (long-term) EMAs confirms the daily chart's trend is officially bullish. The
EMAs now act as dynamic support layers. Any pullback is likely to find buyers at these levels.
Context for the Stochastic Cross: The bullish stochastic cross is now happening within a confirmed bullish trend, not in a downtrend or messy
consolidation. This makes it a trend-following momentum entry, which is one of the most reliable setups.
Narrative is Clear: The weekly says "uptrend." The daily says "we're in a bullish structure, and after a pullback (that likely caused the negative
sentiment and the stochastic dip), momentum is turning back up." The 4H says "the short-term move has already begun."
The Sentiment Paradox Explained
Negative sentiment in the face of this strong technical alignment is often a contrarian bullish indicator. It suggests the move has room to run because the
majority (reflected in sentiment) is still doubtful or underinvested. Their eventual buying as sentiment turns positive will fuel the next leg up.
Final Action Plan & Trade Execution
YES, this is a good buy. The weight of evidence is strongly bullish.
Here is your execution checklist:
Entry: Look for a small pullback or a bullish continuation candle on the 4H or 1H chart to enter, ensuring you're not chasing the move too far. The area near the 50 EMA on the daily would be an ideal, low-risk entry zone if price retraces.
Stop-Loss: Place your stop-loss below the 200 EMA on the daily chart. This level is your "line in the sand." If price closes below the 200 EMA, the bullish
daily structure is invalidated. A tighter stop can be placed below the recent swing low or below the 50 EMA, but the 200 EMA provides more breathing room for normal volatility.
Take-Profit Targets:
Target 1: Previous daily swing high.
Target 2: Measure the move from the recent low to the point where the stochastic crossed and project a 1:1 or 1.5:1 extension.
Final Target: Look for resistance at the next major weekly level.
Risk Management: Given the negative sentiment could cause chop, ensure your position size allows you to withstand some volatility without being stopped out prematurely.
In Summary:
You have a convergence of bullish evidence across three timeframes, anchored by the critical fact that price is trading above the key daily EMAs. The negative
sentiment is the last vestige of the prior pullback and likely represents a lagging indicator or a wall of worry for the market to climb.
Proceed with the buy. Manage your risk with the stop-loss below the 200 EMA, and let the aligned trends work in your favor. This is a textbook "trend
resumption" setup.
Rocket boost this content to learn more.
Disclaimer:Trading is risky please learn risk
management and profit taking strategies.
Also use a simulation trading account
before you trade with real money.

AMD - Hypothetical Projection if the AI bubble popsProbably it's good if the bubble pops.. We can buy our fav. stocks for a discount !!
Short around 240-250 area
Target 1 - 195
Target 2 - 165
Target 3 - 125
Stop loss - 270
- All of the VWAPs converging around 120-130 area
- 200 WMA would be around same zone
Or -
This might be too early for this trade, probably there might be another leg upto 300's to call it a top
