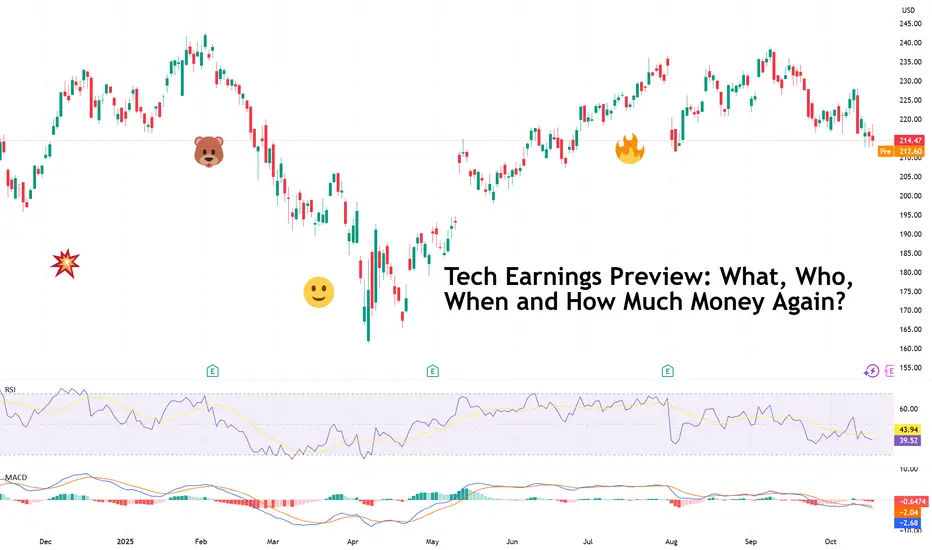
Tech Earnings Preview: What, Who, When and How Much Money Again?“ I don’t know, probably at least around $600 gazillion dollars ,” Zuck, probably if you asked him how much Meta NASDAQ:META will spend over the fiscal year.
It’s earnings season , which means Wall Street’s most expensive hobby — guessing how much the tech giants will make while pretending it’s
Key facts today
50 ARS
54.25 T ARS
584.16 T ARS
About Amazon.com, Inc.
Sector
Industry
CEO
Andrew R. Jassy
Website
Headquarters
Seattle
Founded
1994
ISIN
ARBCOM460176
Amazon.com, Inc. is a multinational technology company, which engages in the provision of online retail shopping services. It operates through the following segments: North America, International, and Amazon Web Services (AWS). The North America segment offers retail sale of consumer products, including from sellers, advertising, and subscriptions services through North America-focused online and physical stores. The International segment focuses on retail sale of consumer products, including from sellers, advertising, and subscription services through internationally-focused online stores. The AWS segment is composed of global sales of compute, storage, database, and other services for start-ups, enterprises, government agencies, and academic institutions. The company was founded by Jeffrey P. Bezos in July 1994 and is headquartered in Seattle, WA.
Related stocks
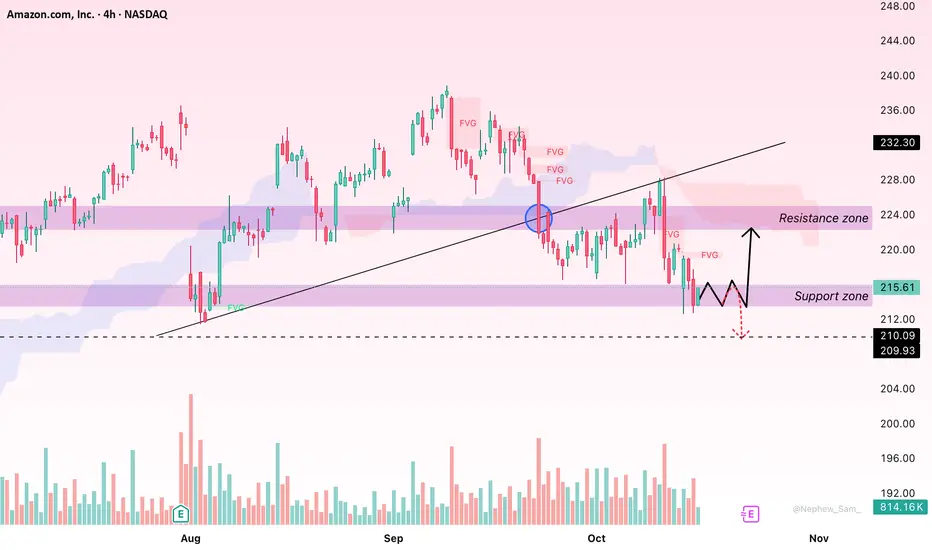
AMAZON (AMZN) - H4 - Double Top Breakdown (19.10.2025)📊 Setup Overview:
Amazon stock (NASDAQ: AMZN) is forming a Double Top Reversal Pattern on the 4H chart, signaling potential weakness after failing twice to break above the major resistance zone near $238–$240.The price has also broken below the ascending trendline with a cloud crossover, confirming

Amazon (AMZN): Pullback Pause or Start of a Deeper Correction?Hello everyone,
Amazon’s stock has drawn attention after sliding from the 220 USD peak to below 216 USD. Looking at the broader picture, this move reflects not only a technical correction but also investors’ growing caution amid mixed U.S. economic signals and uncertainty around the tech sector’s
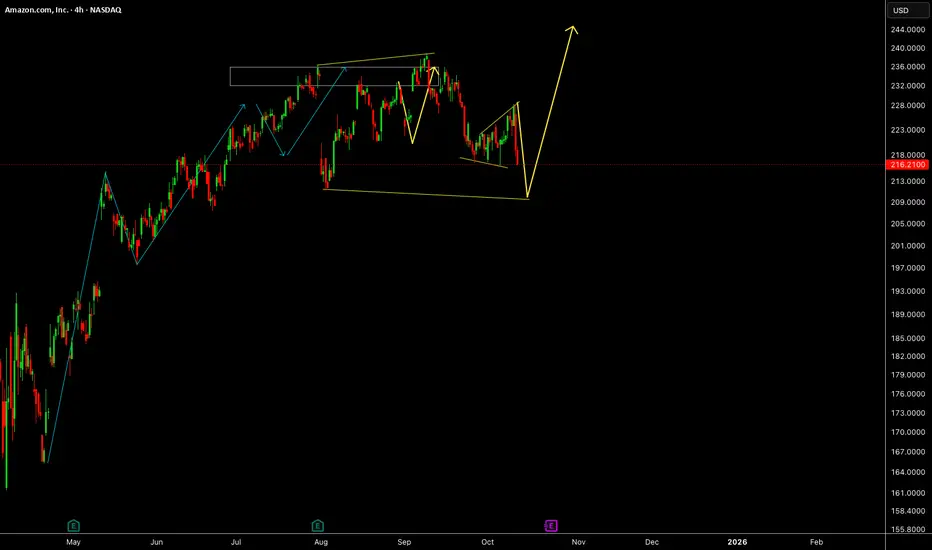
AMAZONAMAZON has done what we expected last week, this week we are expecting an up move to start.
Disclosure: We are part of Trade Nation's Influencer program and receive a monthly fee for using their TradingView charts in our analysis.

AmazonAmazon has given us small push up but slow last week, we will expect some more drop this week before a major push up.
Disclosure: We are part of Trade Nation's Influencer program and receive a monthly fee for using their TradingView charts in our analysis.
Amazon.com Limps Toward EarningsAmazon.com fell on its last earnings report and has continued to struggle as more numbers approach.
The first pattern on today’s chart is the bearish gap on August 1 after weak profit guidance overshadowed strong backward-looking numbers. The ecommerce giant rebounded from the decline but couldn’t

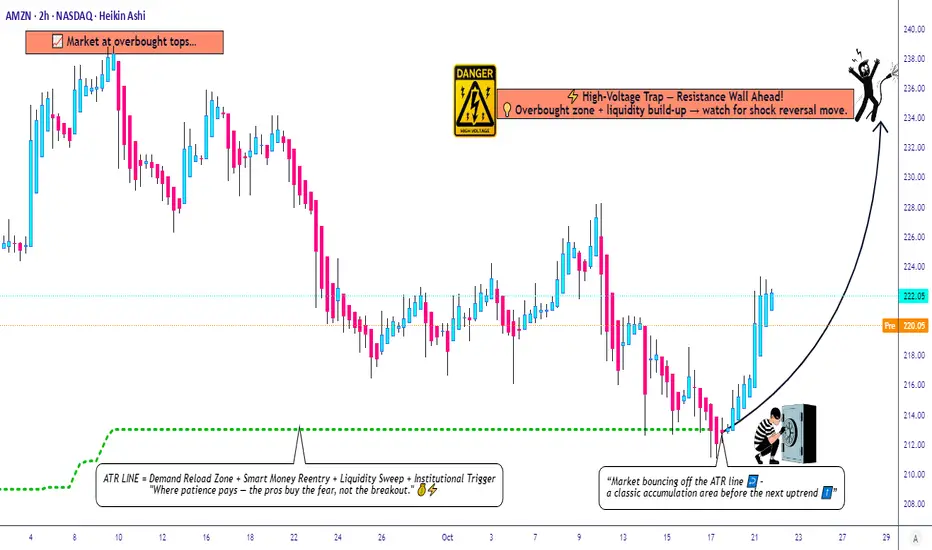
Amazon’s Hidden Pullback Opportunity – Smart Risk, Smart Entry🎯 AMZN: The "Thief's Playbook" — Stealing Profits Like a Wall Street Ninja
📊 Asset Overview
AMAZON.COM INC (NASDAQ: AMZN) — The E-Commerce Titan & Cloud King 👑
Strategy Type: Swing/Day Trade — Bullish Pullback Setup
Confirmation Tool: ATR (Average True Range) ✅
🎭 The "Thief Strategy" Explained
Lis
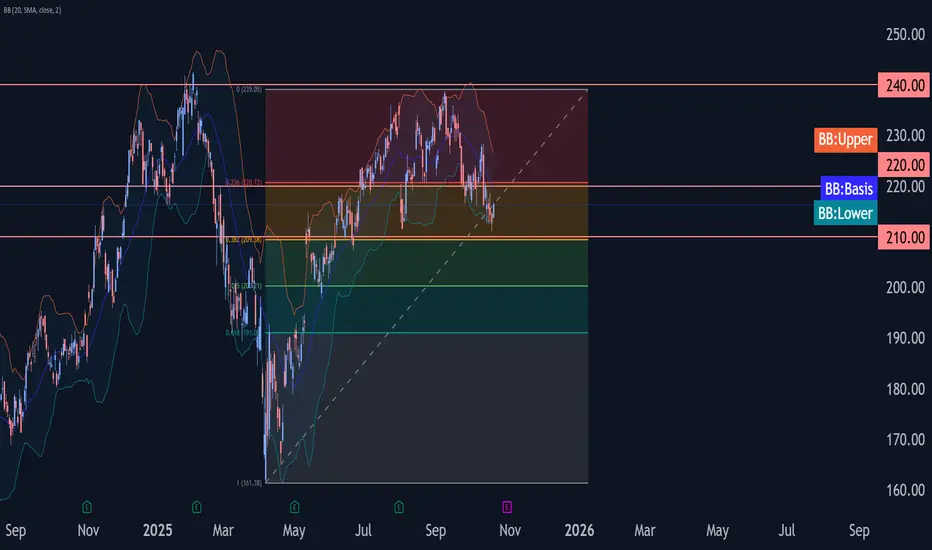
Amazon Wave Analysis – 20 October 2025
- Amazon reversed from support level 210.00
- Likely to rise to resistance level 220.00
Amazon recently reversed from the support area between the key support level 210.00 (which has been reversing the price from June), lower daily Bollinger Band and the 38.2% Fibonacci correction of the upward im
Amazon at the Edge – Bounce or Breakdown?On the daily chart of Amazon (AMZN), the price is sitting right on its long-term uptrend line — a trendline that has supported the stock multiple times since early 2023. The current price hovers around $220, with the 50-day SMA near $225, acting as short-term resistance.
In the short term, a confir

AMZN | Long Setup | AWS/Ads Margin Mix | Oct 20, 2025AMZN | Long Setup | Q4 Seasonality + AWS/Ads Margin Mix | Oct 20, 2025
🔹 Thesis Summary
Amazon underperformed YTD but enters its strongest seasonal window into Q4 with margin mix improving (AWS + Ads). With earnings on Oct 30 and analyst targets clustered above spot, a defined-risk long seeks a cha

See all ideas
Summarizing what the indicators are suggesting.
Oscillators
Neutral
SellBuy
Strong sellStrong buy
Strong sellSellNeutralBuyStrong buy
Oscillators
Neutral
SellBuy
Strong sellStrong buy
Strong sellSellNeutralBuyStrong buy
Summary
Neutral
SellBuy
Strong sellStrong buy
Strong sellSellNeutralBuyStrong buy
Summary
Neutral
SellBuy
Strong sellStrong buy
Strong sellSellNeutralBuyStrong buy
Summary
Neutral
SellBuy
Strong sellStrong buy
Strong sellSellNeutralBuyStrong buy
Moving Averages
Neutral
SellBuy
Strong sellStrong buy
Strong sellSellNeutralBuyStrong buy
Moving Averages
Neutral
SellBuy
Strong sellStrong buy
Strong sellSellNeutralBuyStrong buy
Displays a symbol's price movements over previous years to identify recurring trends.
AMZN5508427
Amazon.com, Inc. 4.6% 01-DEC-2025Yield to maturity
5.28%
Maturity date
Dec 1, 2025
US23135CC8
Amazon.com, Inc. 3.25% 12-MAY-2061Yield to maturity
5.21%
Maturity date
May 12, 2061
US23135CK0
Amazon.com, Inc. 4.1% 13-APR-2062Yield to maturity
5.17%
Maturity date
Apr 13, 2062
US23135BT2
Amazon.com, Inc. 2.5% 03-JUN-2050Yield to maturity
5.17%
Maturity date
Jun 3, 2050
AMZN4531868
Amazon.com, Inc. 4.25% 22-AUG-2057Yield to maturity
5.16%
Maturity date
Aug 22, 2057
US23135CJ3
Amazon.com, Inc. 3.95% 13-APR-2052Yield to maturity
5.15%
Maturity date
Apr 13, 2052
AMZN4996701
Amazon.com, Inc. 2.7% 03-JUN-2060Yield to maturity
5.14%
Maturity date
Jun 3, 2060
AMZN5182959
Amazon.com, Inc. 3.1% 12-MAY-2051Yield to maturity
5.13%
Maturity date
May 12, 2051
AMZN4531866
Amazon.com, Inc. 4.05% 22-AUG-2047Yield to maturity
5.08%
Maturity date
Aug 22, 2047
US23135AQ9
Amazon.com, Inc. 4.95% 05-DEC-2044Yield to maturity
4.88%
Maturity date
Dec 5, 2044
AMZN5182958
Amazon.com, Inc. 2.875% 12-MAY-2041Yield to maturity
4.88%
Maturity date
May 12, 2041
See all AMZNB bonds
Curated watchlists where AMZNB is featured.


