BABA QuantSignals V3 Weekly 2025-11-05BABA QuantSignals V3 Weekly 2025-11-05
BABA Weekly Signal | 2025-11-05
• Direction: BUY CALLS | Confidence: 55%
• Expiry: 2025-11-07 (2 days)
• Strike Focus: $165.00
• Entry Range: $2.42
• Target 1: $3.50
• Stop Loss: $1.80
• Weekly Momentum: NEUTRAL (+0.60% 1W)
• Flow Intel: Neutral | PCR 1.18
• Max Pain: $170.00 (+2.5% vs spot)
• 🔴 HIGH RISK WARNING: Use only small position size due to lower confidence and high uncertainty.
⚖️ Compliance: Educational commentary for QS Premium members only. No financial advice.
🎯 TRADE RECOMMENDATION
Direction: BUY CALLS
Confidence: 55%
Conviction Level: LOW
🧠 ANALYSIS SUMMARY
Katy AI Signal: Katy AI shows NEUTRAL trend with HOLD signal, but the price target of $164.88 suggests a slight bearish tilt (-0.6% from current). This creates fundamental conflict with my analysis.
Technical Analysis: Current price $165.80 near session lows, down 6.49% on the day. Weekly momentum neutral but with +1.46% two-week bullish trend. EMA alignment shows bullish confirmation. Key resistance at $168.29 (Katy's stop level), support at $161.70 session low.
News Sentiment: Bullish catalysts with recent AI trading success stories highlighting Alibaba's AI outperforming competitors. Positive sector momentum in AI technology, though general market sentiment remains cautious.
Options Flow: Neutral put/call ratio of 1.18 suggests balanced positioning. Unusual activity at $205 put indicates institutional hedging. Max pain at $170.00 provides upward pressure target.
Risk Level: HIGH - Katy AI shows neutral/bearish bias conflicting with bullish trade setup. Low conviction due to mixed signals and short 2-day window.
💰 TRADE SETUP
Expiry Date: 2025-11-07 (2 days)
Recommended Strike: $165.00
Entry Price: $2.35 - $2.48
Target 1: $3.50 (49% gain from entry)
Target 2: $4.20 (79% gain from entry)
Stop Loss: $1.80 (24% loss from entry)
Position Size: 1% of portfolio (low conviction due
Image
QS Analyst
APP
— 5:37 PM
to Katy conflict)
⚡ COMPETITIVE EDGE
Why This Trade: Combovershoots Katy's conservative target with strong AI news catalyst and max pain level alignment
Timing Advantage: Mid-week positioning before weekly expiration gamma squeeze potential
Risk Mitigation: Strike selection at $165 provides favorable delta (0.573) with current price action support
🚨 IMPORTANT NOTES
⚠️ CRITICAL CONFLICT: Katy AI shows NEUTRAL/HOLD with $164.88 target (-0.6%) while this is a CALL recommendation. This trade goes against Katy's primary signal.
⚠️ Extremely short timeframe (2 days) increases gamma risk significantly
⚠️ Low volume session (0.1x average) reduces momentum confirmation
⚠️ Only for experienced traders comfortable with high-risk weekly options
📊 TRADE DETAILS 📊
🎯 Instrument: BABA
🔀 Direction: CALL (LONG)
🎯 Strike: 165.00
💵 Entry Price: 2.42
🎯 Profit Target: 3.50
🛑 Stop Loss: 1.80
📅 Expiry: 2025-11-07
📏 Size: 1.0
📈 Confidence: 55%
⏰ Entry Timing: N/A
🕒 Signal Time: 2025-11-05 20:37:15 EST
🔴 HIGH RISK WARNING: Use only small position size due to lower confidence and high uncertainty.
Alibaba Group Holding Limited ADS Cert Deposito Arg Repr 1/9 ADS
No trades
Market insights
$BABA | ABC Correction in Progress (VolanX DSS View)Alibaba is showing early signs of completing an ABC corrective structure on the daily chart.
🔹 Structure & Levels
Wave A: Initial impulse top near $187.5
Wave B: Mid retrace capped around $179–180 (current zone)
Wave C: Expected corrective leg aiming toward the $164.38 liquidity area, possibly extending into $148–150 if macro weakness persists
🔹 Key Observations
Price reacting sharply near Fib 0.786 retrace ($173–$176)
Daily structure aligning with macro consolidation phase
Below $170, downside acceleration likely toward the 200 EMA region
Bullish invalidation: Daily close above $187 (resets structure bias)
🔹 Outlook (VolanX DSS)
The VolanX DSS currently signals short-term exhaustion, suggesting probability of a corrective pullback before the next impulse leg.
Macro catalysts—China’s liquidity policy and USD strength—remain the key external variables for direction confirmation.
🎯 Projected Zones
Near-term retrace: $164.38
Deeper support: $148.21
Long-term target post-reset: $213.66+
⚙️ Analysis generated with VolanX DSS (LSTM + Liquidity-Flow hybrid).
📊 Educational content. Not financial advice.

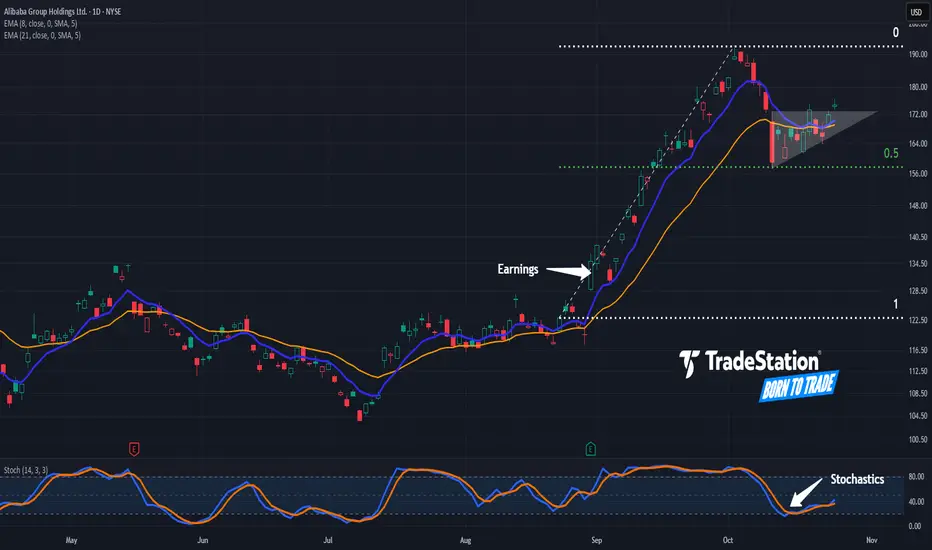
Potential Continuation Patterns in AlibabaAlibaba rallied in September. Now, after a pullback, some traders may see potential for continuation.
The first pattern on today’s chart is the advance between August 22 and October 2. The Chinese e-commerce giant stabilized after retracing half the move, which may suggest its direction remains upward.
Second, you have the series of higher lows since October 10 with prices mostly trapped below $173. That ascending triangle may be viewed as a bullish continuation pattern.
Third, the 8-day exponential moving average (EMA) has remained above the 21-day EMA.
Next, stochastics are rebounding from an oversold condition.
Finally, BABA is an active underlier in the options market. That could help traders take positions with calls and puts.
TradeStation has, for decades, advanced the trading industry, providing access to stocks, options and futures. If you're born to trade, we could be for you. See our Overview for more.
Past performance, whether actual or indicated by historical tests of strategies, is no guarantee of future performance or success. There is a possibility that you may sustain a loss equal to or greater than your entire investment regardless of which asset class you trade (equities, options or futures); therefore, you should not invest or risk money that you cannot afford to lose. Online trading is not suitable for all investors. View the document titled Characteristics and Risks of Standardized Options at www.TradeStation.com . Before trading any asset class, customers must read the relevant risk disclosure statements on www.TradeStation.com . System access and trade placement and execution may be delayed or fail due to market volatility and volume, quote delays, system and software errors, Internet traffic, outages and other factors.
Securities and futures trading is offered to self-directed customers by TradeStation Securities, Inc., a broker-dealer registered with the Securities and Exchange Commission and a futures commission merchant licensed with the Commodity Futures Trading Commission). TradeStation Securities is a member of the Financial Industry Regulatory Authority, the National Futures Association, and a number of exchanges.
Options trading is not suitable for all investors. Your TradeStation Securities’ account application to trade options will be considered and approved or disapproved based on all relevant factors, including your trading experience. See www.TradeStation.com . Visit www.TradeStation.com for full details on the costs and fees associated with options.
Margin trading involves risks, and it is important that you fully understand those risks before trading on margin. The Margin Disclosure Statement outlines many of those risks, including that you can lose more funds than you deposit in your margin account; your brokerage firm can force the sale of securities in your account; your brokerage firm can sell your securities without contacting you; and you are not entitled to an extension of time on a margin call. Review the Margin Disclosure Statement at www.TradeStation.com .
TradeStation Securities, Inc. and TradeStation Technologies, Inc. are each wholly owned subsidiaries of TradeStation Group, Inc., both operating, and providing products and services, under the TradeStation brand and trademark. When applying for, or purchasing, accounts, subscriptions, products and services, it is important that you know which company you will be dealing with. Visit www.TradeStation.com for further important information explaining what this means.
ALIBABA HIGH PROBABILITY SETUP SOON!!!🚨 BABA HIGH PROBABILITY BUY SETUP 🚨
* Here We Can See Clearly The Next Potential Moves For BABA Coming Hours/Days.
* Keep Your Eyes Close On Your Trading Positions.
* Happy PIP Hunting Traders.
FXKILLA.

Tutorial on Andrews Pitchfork on AlibabaThis is an analysis of Alibaba stock using the Andrews pitchfork.


Baba Price Reversal on Quarterly. Baba Is bullish again. This is a Quarterly chart.
Fair value Gap between $180-$204 on Quarterly chart.
Price action suggests Baba is poised to make big moves and it's P/E ratio is also only Around 12.
AI hype is coming too for Baba since they have Qwen AI on their hands.
Stop Loss and Target mentioned in the Post. Now let's see what happens.
P.S. This is not a financial advice. This is an educational and speculative post only. Do your own research.

Opportunity to buy Alibaba shares For those who are regretting not getting onboard the Alibaba ship earlier, now is your opportunity. It is highly likely that when HK market opens tomorrow, this counter will head south , hopefully 5-8% as the Alibaba shares in US market was down 8% upon closing last Friday.
The first buying zone will be between 147 - 150 price level. Here, you deploy your first tranche of capital. The all important news that everyone is waiting will be how China will retaliate next week given the new tariffs will be effective on Nov 1. I expect some volatility of both countries firing at one another (trade tactics) before we see some form of settlement before Nov 1. The game is nothing new.
If we are lucky and tech shares get sell down even more , then we can the price revisit the 118-128 price level. Here, you can deploy 20% more capital to go LONG.
The above analysis is based on one's conviction in Alibaba's fundamentals and future position in the AI space.
As usual, please DYODD.

Alibaba Correction After Ant Group AI LaunchAlibaba Falls Following Ant Group’s New AI Model Launch: Opportunity or Bearish Pressure?
Ion Jauregui – Analyst at ActivTrades
Ant Group, the fintech subsidiary backed by Jack Ma and Alibaba Group (NYSE: BABA), announced the launch of Ling-1T, its new open-source artificial intelligence model designed to compete with DeepSeek V3.1 Terminus and OpenAI’s GPT-5. This model, with one trillion parameters, aims to position itself among the most powerful tools in the sector, highlighting its capabilities in complex reasoning, code generation, and advanced mathematical problem-solving. Ant Group stated that Ling-1T delivers “enhanced results” across multiple coding benchmarks, even outperforming Western competitors in technical tests. This development reinforces China’s role in the global AI race, where companies like Baidu, Tencent, and Huawei are also pushing to strengthen their technological leadership.
The move is part of a broader strategy by Beijing to boost domestic production of AI chips and processors, a key component in the country’s technological autonomy amid U.S. export restrictions. However, despite the innovative push, Alibaba (BABA) shares fell -4.11% following the announcement, reflecting investor uncertainty about the actual impact of this development on the group’s financial results, which continue to face regulatory pressure and tight margins in its e-commerce business.
Technical Analysis of Alibaba (Ticker AT: BABA)
BABA remains in a short-term downtrend after breaking the key support at $161.30, with a recent decline toward $169.53, a level close to the immediate support of its last upward move. Since the rally that began around $120, coinciding with the current Point of Control (POC), this technical rebound suggests that prices could still test lower levels due to the broad structure of its price distribution. Its inability to break previous highs may push the price toward current support, and a failure to hold this level could drive it down to the next support around $146.
RSI indicates a correction from an oversold condition toward a neutral zone at 57.72%, while the MACD histogram remains in negative territory, though its signal and average lines are currently positive, suggesting a possible short-term pause in the long-term upward move.
Moving averages maintain a bullish bias, with yesterday’s close holding above the 50-day moving average and the support of the last bullish impulse.
Resistances: Current high at $192.67
Supports: Key levels at $161.30, $145.98, and $141.34
Indicators: RSI neutral, MACD in a temporary bearish correction, moving averages maintain bullish structure.
The technical outlook suggests a potential lateral consolidation zone after the short-term correction, although the sharp pullback could present buying opportunities if the price manages to stabilize above recent highs with increasing volume.
Alibaba Leading the AI Ecosystem
Ant Group’s progress in artificial intelligence strengthens Alibaba’s position in China’s technology ecosystem, but the market still demands tangible monetization of these developments. Meanwhile, volatility and the competitive environment could continue to pressure the stock. In the medium term, the consolidation of Ling-1T and its commercial applications will be critical for Alibaba to regain investor confidence and potentially reverse the current trend.
*******************************************************************************************
The information provided does not constitute investment research. The material has not been prepared in accordance with the legal requirements designed to promote the independence of investment research and such should be considered a marketing communication.
All information has been prepared by ActivTrades ("AT"). The information does not contain a record of AT's prices, or an offer of or solicitation for a transaction in any financial instrument. No representation or warranty is given as to the accuracy or completeness of this information.
Any material provided does not have regard to the specific investment objective and financial situation of any person who may receive it. Past performance and forecasting are not a synonym of a reliable indicator of future performance. AT provides an execution-only service. Consequently, any person acting on the information provided does so at their own risk. Political risk is unpredictable. Central bank actions can vary. Platform tools do not guarantee success.

Alibaba Group Holding buying opportunityAlibaba is potentially in the process of making a head and shoulder patten.
Break of neckline should be with heavy volume to be successful.

Alibaba Weekly Elliot Waves AnalysisBABA is currently in Wave 5. I believe BABA Wave 5 will be an ABC correction. With that being said, I expect a relief pump (wave B) to happen which will last for 1-2 weeks before we continue dumping. I have buy orders set for $85/$86 and at worse, $58. $100 support looks weak based on the lower Fibonacci targets. Be diligent with this one!
(Side Note: Wave 1 was also an ABC correction which is why the last wave will be similar to the first.)
You can learn more about this analysis by researching ABC corrections and Zigzags. Thank you!

BABA Perfect long positionNYSE:BABA is at a strong level ahead of its next upcoming earnings, I am looking for it to continue within its already formed parallel channel on the weekly chart. The daily shows a strong rejection of its 50ema, consequently breaking a previous swing high. the break indicates possibility of bullish momentum through the level. The current consolidation phase into the long term trend and the consolidation occurring on the long term volume profile POC, all act as positive confluence to the general idea of a mid-long term buy position on BABA. CN50 is also showing great strength on the monthly chart, which is a great confluence with BABA's overall performance.
Constriction of Bollinger daily bands is an added confluence, indicating the potential for increased volatility and a large move to come out of this consolidation phase in the near term.
I have entered a large long position, with stops shown at levels shown on chart to allow the trade to breath in the midst of unexpected volatility around earnings etc. Stops and tp may be adjusted as conditions change.
Goodluck trading ;)
BABAMy view of the stock BABA for the coming period may be that during the next month, the goals will be achieved

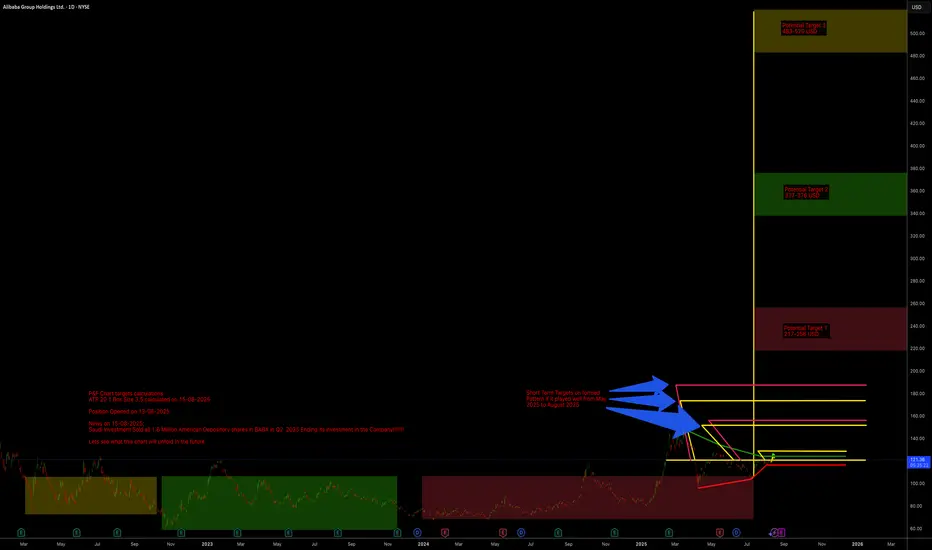
Ali BABA Potential Huge Up Targets ALi BABA have Potential Huge Up Targets with potential 3 years accumulation range from March 2022 to today 15 August 2025.
P&F Chart targets calculations
ATR 20 1 Box Size 3.5 calculated on 15-08-2025
Position Opened on 13-08-2025
News on 15-08-2025:
Saudi Investment Sold all 1.6 Million American Depository shares in BABA in Q2 2025 Ending its investment in the Company!!!!!!!
Lets see what this chart will unfold in the future
Trade With the Tide, Not the Ripple
Most traders misread the idea of “trading with the trend.” Instead of aligning with the primary trend, they zoom into the shortest time frame that agrees with their bias. That’s not discipline—it’s ego at work.
On my desk, the best tool isn’t an indicator or AI—it’s my red couch. I scroll through charts and simply ask: Is this market going up, down, or sideways? No need for clutter. The trend is obvious when you stop trying to force it.
Why do traders avoid the obvious?
FOMO makes them chase every wiggle.
Entertainment makes waiting feel unbearable.
Social media pressure tells them they must scalp or they aren’t real traders.
But real trading is patience. Jim Rogers put it best:
“I just wait until there is money lying in the corner, and all I have to do is go over there and pick it up.”
Patience costs nothing. Impulse costs everything.
Trade with the tide. Leave the ripples to the crowd.
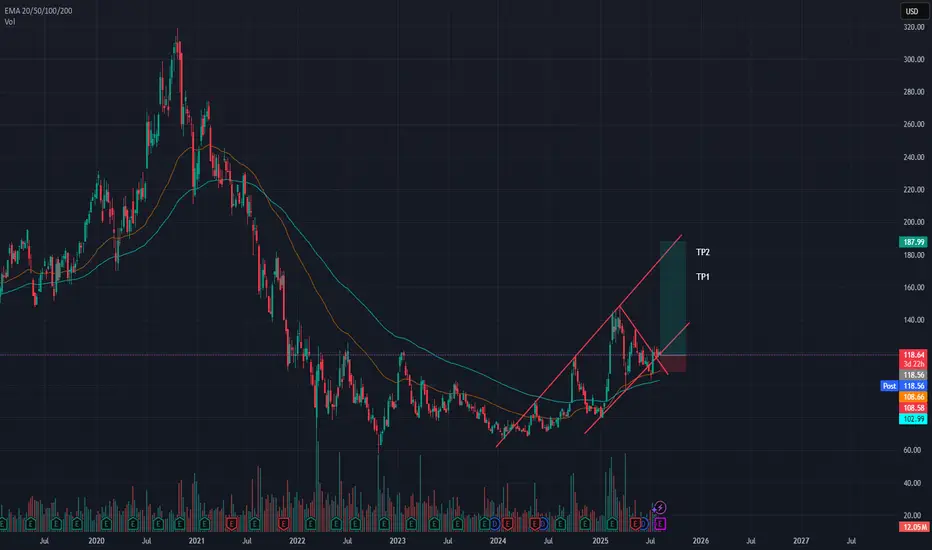
BABA: triangle with tensionOn the weekly chart, BABA has already formed a golden cross - price is above both MA50 and MA200, confirming a bullish trend shift. The stock is now approaching the upper edge of the symmetrical triangle and the key resistance at $122, which also aligns with the 0.5 Fibonacci level.
The numbers inside the triangle represent the contraction phases, not Elliott waves. This is a classical consolidation before a potential breakout. If the $122 level is broken and retested, upside targets are $128 (0.618), $137 (0.786), and eventually $148–181 (1.0–1.618 extension).
Volume is rising, MACD is flipping bullish, and RSI is climbing out of oversold territory — all signs point to growing bullish momentum.
Fundamentally, Alibaba benefits from China's economic rebound, possible regulatory relief, and ongoing share buybacks. With Chinese tech rotating back into favor, BABA could lead the rally.
So if you're still waiting for a signal - it's already here. The golden cross is done, price is flying above moving averages, and all that’s left is a clean breakout. Watch $122 — that’s the launchpad.

Time for reversal?Lots of accumulation on a strong support line from 2015 and almost meets the conditions for a perfect harmonic bat pattern.

Alibaba probably near “bottom”. 19/Oct/22As Alibaba previous long term impulsive move was a “leading diagonal” pattern. So there is high “possibility” that its stock price “might hold” above 57.20..

BABA ending a very clean Wyckoff Acumulation schematic here?As the title says. Appears to be a very clean accumulation schematic. Currently in the SOS area. Consolidation could continue for months here. Timing is hard, let's see what happens over the next weeks and months.

Alibaba - Here we have the final bottom!🏮Alibaba ( NYSE:BABA ) finally created its bottom:
🔎Analysis summary:
As we are speaking, Alibaba finally managed to create a long term bottom formation. Specifically with the recent bullish break and retest, bulls are picking up momentum. We just have to see a break above the current key resistance level in the foreseeable future!
📝Levels to watch:
$140
SwingTraderPhil
SwingTrading.Simplified. | Investing.Simplified. | #LONGTERMVISION

BABA Alibaba Group Holding Limited Options Ahead of EarningsIf you haven`t bought the dip on BABA:
Now analyzing the options chain and the chart patterns of BABA Alibaba Group Holding Limited prior to the earnings report this week,
I would consider purchasing the 135usd strike price Calls with
an expiration date of 2025-9-19,
for a premium of approximately $14.25.
If these options prove to be profitable prior to the earnings release, I would sell at least half of them.

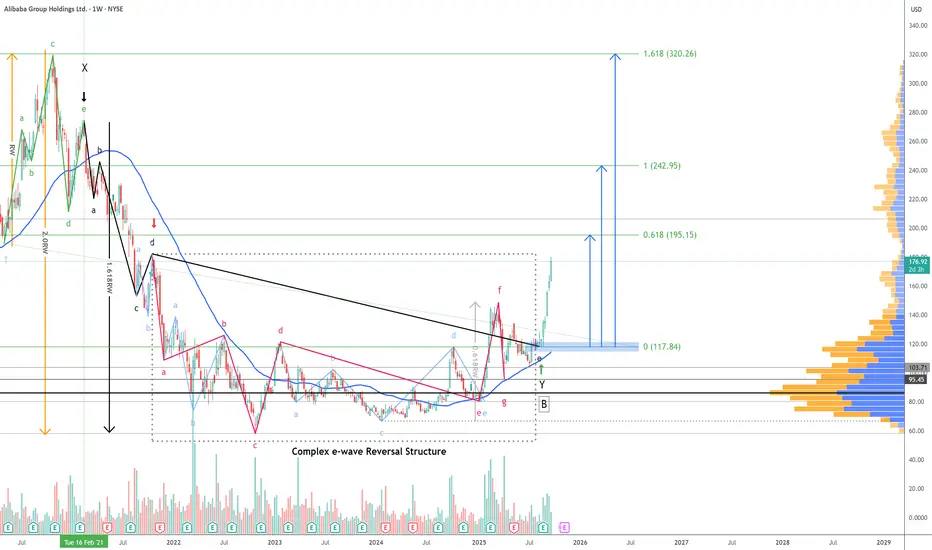
$BABA - Structure Confirmed, Targets In Motion - 9/24/2025Back in February, we discussed how NYSE:BABA was approaching the final stages of a reversal pattern. That call has now been confirmed with the structure concluding at $117. What followed was nothing short of explosive—a 51% upswing rally that’s currently unfolding with strong momentum. 📈
Note: The stock bounced twice off the 50-week moving average, signaling strong support as the correction neared its end.
The chart highlights the projected targets for this new rally, and for transparency and educational value, the internal wave structure and labeling have been intentionally left visible. This is especially insightful for traders exploring Modern Trading Algorithms and their structural variations.
Let the rally do the talking! 📊. 🚀
Happy Trading!
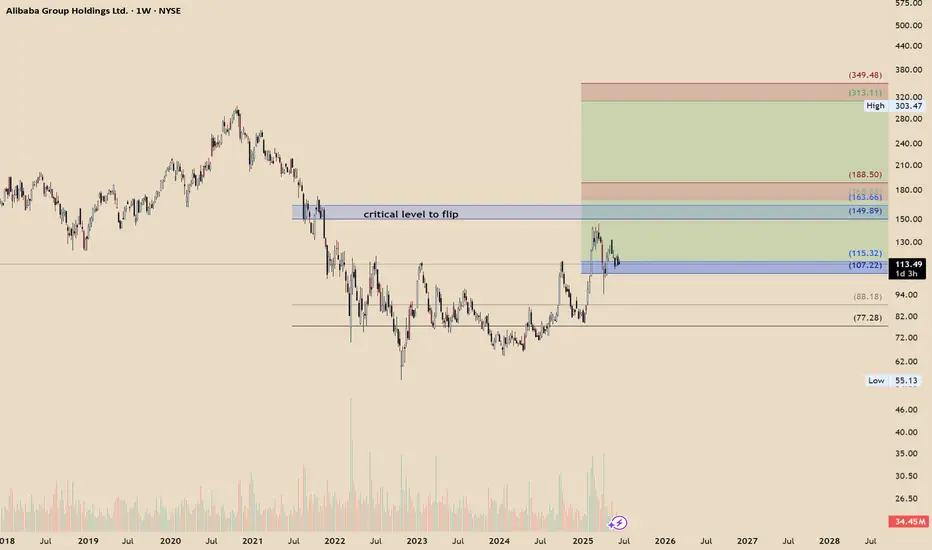
BABA undervaluedHello
BABA has invalidated any corrective attempts due to its price action — a 3-month bullish breaker is in play, and the price has yet to test the first level of algorithmic targets around 163–168.
There’s also a critical level to flip near 149, and I’m fairly confident it will be reclaimed if market conditions permit.
NFA