Alibaba (BABA) Shares Soar ~13% After Earnings ReportAlibaba (BABA) Shares Soar ~13% After Earnings Report
Alibaba published its second-quarter report on Friday morning. Although the company’s gross revenue came in below analysts’ forecasts ($34.6bn vs $35.1bn), BABA’s share price surged by around 13% (to its highest level since March) as the market reacted positively to:
→ Faster growth in cloud services revenue, seen as key to the company’s success in monetising artificial intelligence, similar to Microsoft and Google.
→ Testing of a new processor designed to reduce reliance on Nvidia.
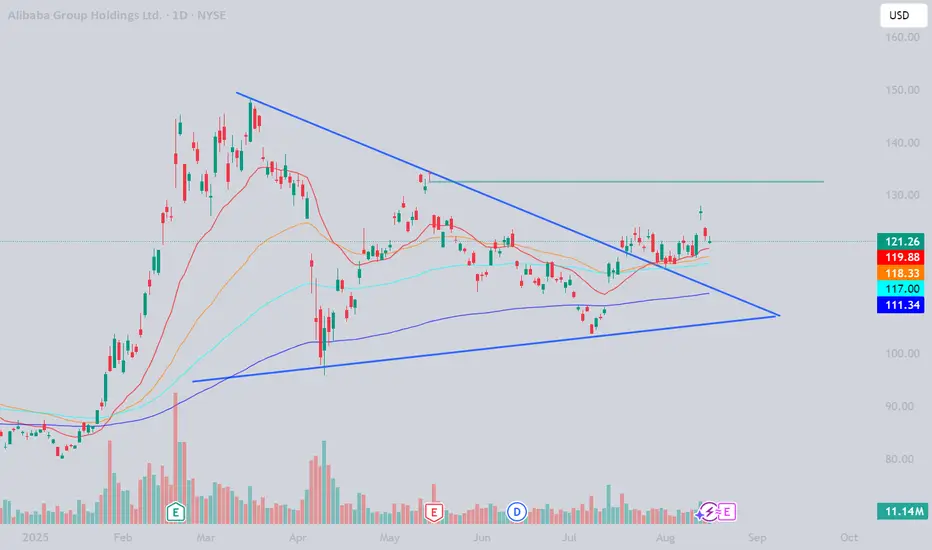
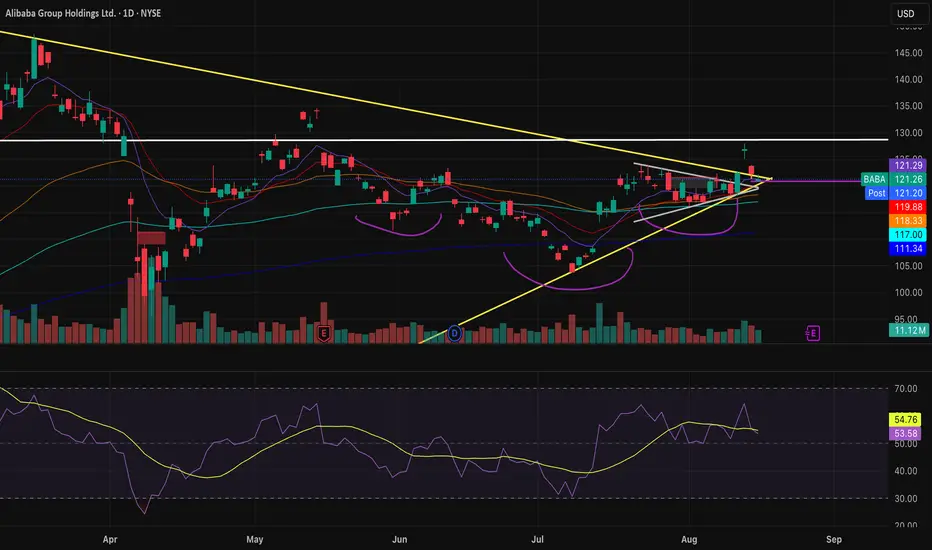
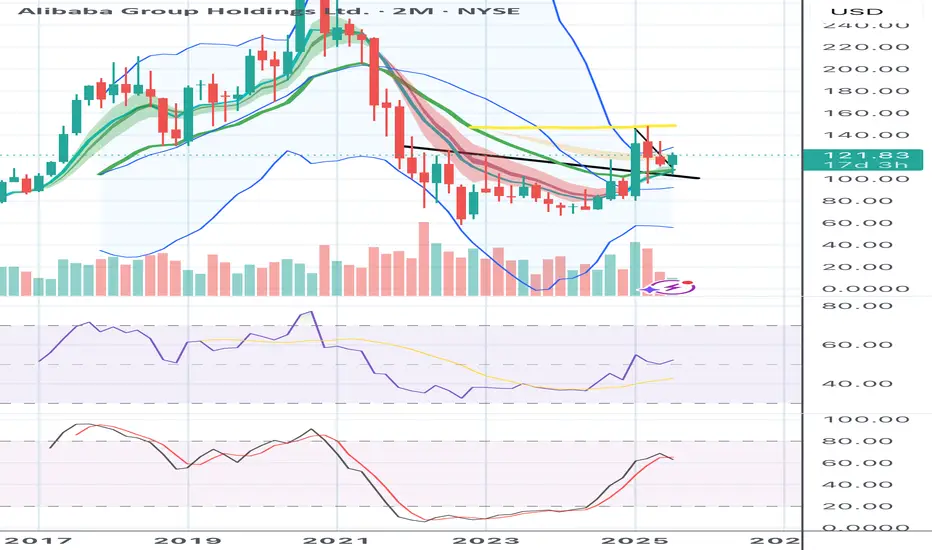
Technical analysis of Alibaba (BABA) shares
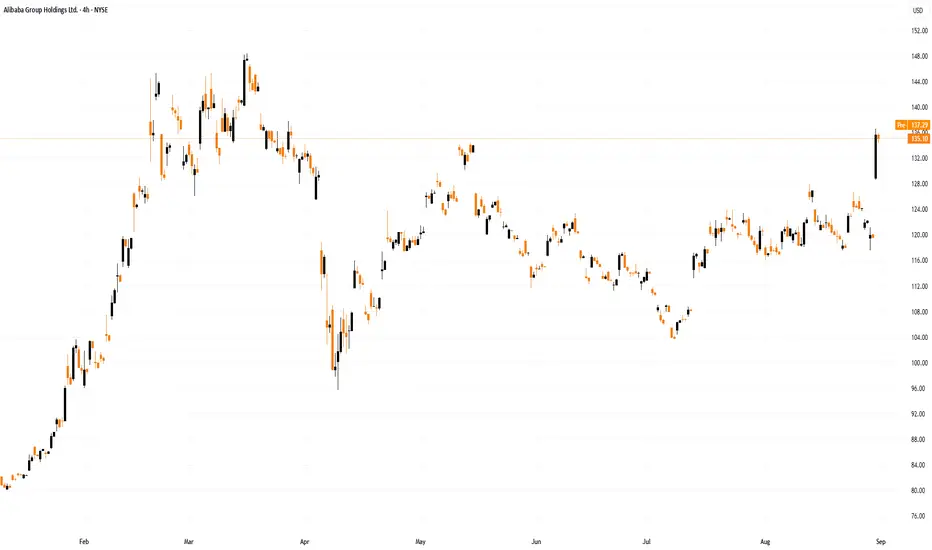
When analysing BABA’s price movements in early July, we identified a resistance zone at $126–$145.
Since then, the price tested the $126 level twice in August, reversing downwards each time. However, the earnings release triggered a wide bullish gap, meaning that $126 could now act as support.
Further bullish arguments:
→ The A-B-C-D-E formation created a contracting triangle, which can be interpreted as a long-term balance of supply and demand. The current bullish impulse breaks this balance, pointing to the potential for a major bullish trend.
→ Starting from point D, price movements have formed an ascending channel (shown in blue), with its median and lower boundary potentially serving as support.
From a bearish perspective, the sharp 19% rise could encourage investors to take profits on existing long positions, as the RSI indicator has moved into overbought territory and BABA’s share price is close to the upper boundary of the blue channel.
Taking all of this into account, we could assume that after the initial strong emotional reaction to the news, the market may reassess its impact and BABA’s share price could correct (for instance, towards the lower boundary of the gap at $128.22).
At the same time, the strong fundamental outlook, driven by the company’s prospects of becoming a leader in the AI sector, suggests that by the end of 2025 we may see an attempt to break above the March high (point A).
This article represents the opinion of the Companies operating under the FXOpen brand only. It is not to be construed as an offer, solicitation, or recommendation with respect to products and services provided by the Companies operating under the FXOpen brand, nor is it to be considered financial advice.
Trade ideas
BABA About to EXPLODE—Weekly 140C Play—Don’t Miss Out
# 🐂💎 BABA WEEKLY OPTIONS ALERT (2025-09-01) 🚀📈🔥
### 📊 Multi-Model Consensus → **STRONG BULLISH**
* ✅ **Momentum:** RSI Daily 71 / Weekly 74 📈
* ✅ **Volume Surge:** 🔺 2.9x last week → Institutions loading bags 👜
* ✅ **Options Flow:** Calls ≈ 2.84x puts 💥
* ✅ **Volatility:** VIX \~15.3 → perfect for calls 🎯
---
### 🎯 Recommended Trade (Consensus Pick)
👉 **BABA 140C (2025-09-05)**
💵 Entry: \~\$1.59
🛑 Stop: \$0.95 (-40%)
🎯 Target: \$2.39 (+50%)
📏 Size: 1 contract (risk-adjust)
⏰ Entry: Market open
🔥 Confidence: 85%
---
### ⚡ Aggressive Play (OTM)
👉 **BABA 145C (\~\$0.84)**
⚡ Higher leverage, stronger flow, but faster theta decay ⏳
---
### 🕒 Risk & Exit Plan
* Close **by Thursday EOD** 🗓️ (avoid Friday theta/gamma trap)
* Stick to stop-loss & risk sizing 💡
* Watch for profit-taking after +9.8% last week 📉
---
📌 **Trade JSON (for algo/backtest nerds 🤓)**
```json
{
"instrument": "BABA",
"direction": "call",
"strike": 140.0,
"expiry": "2025-09-05",
"confidence": 0.85,
"profit_target": 2.39,
"stop_loss": 0.95,
"size": 1,
"entry_price": 1.59,
"entry_timing": "open",
"signal_publish_time": "2025-09-01 22:19:55 EDT"
}
```
---
\#️⃣ **Hashtags / Tags**
\#BABA #OptionsTrading #FlowTrading #StockMarket 🚀📈🔥
\#UnusualOptionsActivity #SwingTrade #TradingSignals #SmartMoneyFlow
\#CallOptions #WeeklyOptions #ChinaStocks
Alibaba Group Holding Ltd. ADR (BABA) Powers China’s RetailAlibaba Group Holding Limited Sponsored ADR (BABA) is a global leader in e-commerce, cloud computing, digital media, and fintech innovation. Best known for its massive online marketplaces like Taobao and Tmall, Alibaba also drives growth through its cloud platform, Alibaba Cloud, and digital payment arm, Alipay. The company’s growth is fueled by rising online shopping demand, digital transformation across China and globally, and continued innovation in technology and services.
On the chart, a confirmation bar with rising volume highlights strong momentum. The price has entered the momentum zone after breaking above the .236 Fibonacci level. A trailing stop can be placed just below this Fibonacci mark using the Fibonacci snap tool, helping traders secure profits while leaving room for further upside potential.

Is Alibaba a Buy: Fundamental Deep DiveWe have looked over some key metrics of Alibaba.
Based on Revenue, Debt, Net Income, PE, Free Cash Flow and other metric we have concluded that Alibaba can continue to move higher.
We provide some baseline targets based off of wall street EPS estimates.
We prove some hyperbolic targets based off of historical median PE targets.
Its amazing how much risk premium is built into this China valuation as Alibaba sure looks good.
EPS is set to continue to surge, Cap Ex spending should slow, net debt has been reducing.
All key metrics support a stronger balance sheet and a continued growth.
Baba cloud division is finally turning profitable and if this continues will be a major tailwind for the stock.
New AI chip development could catapult this stock as it tries to capture a tiny share of NVDA market.
We have been long NYSE:BABA since early July and will continue to buy on pullbacks (Not FA advice)

Is Alibaba entering a stage 2 breakout formation? This video depicts a pure technical summary of Alibaba on multiple different time frames.
We will follow this video up with a fundamental view.
Using previous cycles we believe Alibaba is poised for a 12-24 month explosive move.
Baba looks o be entering the explosive stage 2 formation.
Breaking out and defending monthly chart support...Baba looks great on all time frames.
Many bullish patterns are triggering....Weekly bull flags / inverse head and shoulders.
The minimum upside target if the bullflag completes is around 160 - 165.
We have been long Baba since early July when it kissed the daily 200 MA.

Alibaba looking to move higherToday's results seem to have trigger Alibaba for much higher levels. The market seems to have appreciated the growth of its cloud and AI business as well as its new AI chips.
Chinese big cap techs are much cheaper than US counterparts and seem to be presenting interesting opportunities.
Next resistance/target in the $170 area as long as $117 support is holding.
BABA Earnings Play---Don’t Miss Out
# 🚀 BABA Earnings Play (8/28 AMC) 🚀
💎 **Moderate Bullish | 72% Conviction** 💎
🎯 **Trade Setup**
📊 Ticker: \ NYSE:BABA
🔀 Direction: CALL 📈
🎯 Strike: 130.00
📅 Expiry: 2025-08-29
💵 Entry: 0.83 (ASK)
⏰ Timing: Pre-earnings close (8/28 AMC)
📦 Size: 1 contract (risk 💸 \$83)
🎯 Target: 2.49 (200%)
🛑 Stop: 0.42 (-50%)
⚡️ **Why Bullish?**
* 📈 Strong margins & FCF cushion
* 🔥 Call OI stacked at \$125–130 (gamma fuel)
* 📊 Price above key MAs, neutral RSI → upside ready
* 🌎 Macro risk still there, but market tilt is bullish
✅ **Execution Rule**: In before close, out within 2h post-print or at target/stop.
---
### 📌 Suggested Tags (TradingView-style)
\#BABA #Alibaba #EarningsPlay #OptionsTrading #CallOptions #WeeklyOptions #BullishSetup #MomentumTrading #TradeIdeas #StockMarket 🚀📊

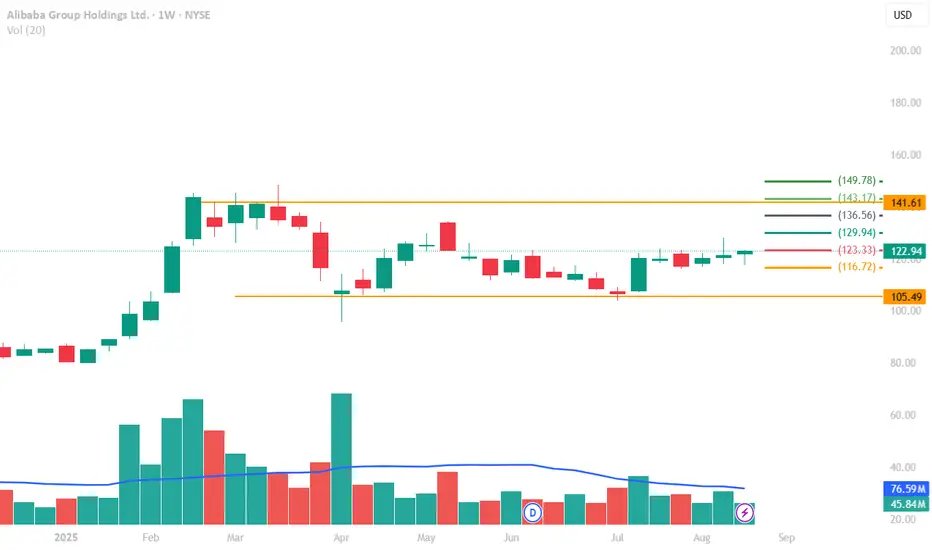
Alibaba (NYSE) (W)– Range Bound, Eyeing for BreakoutPrice / Momentum : Weekly close $122.94 (+1.39%); currently challenging minor resistance near $123. The structure shows sideways consolidation after a sharp run-up earlier in the year.
Volume : Volume is subdued compared to the February–April surge, indicating a lack of strong conviction yet. A volume spike would be needed to confirm a breakout.
Structure / Pattern: Price remains in a horizontal range between $105 (support) and $141 (resistance). The recent higher low near $116.7 suggests buyers are defending dips.
Key Levels:
Resistance/Breakout: $123.3, then $129.9 → $136.5 → $143.1 → $149.8 (upside targets).
Support: $116.7 (near-term); $105.5 (major support).
Bias & Trade Idea : Neutral-to-bullish bias while above $116.7. A decisive breakout above $123–124 with volume could open room toward $130+. Failure to clear $123 soon could lead to another retest of $116–105 support zone.
⚠️ Disclaimer : This chart is for educational purposes only.
Regulatory Note: We are an independent development team. Our services are not registered or licensed by any regulatory body in India, the U.S., the U.K., or any global financial authority. Please consult a licensed advisor before making trading decisions.
$baba yieahhhhyieahhhh
NYSE:BABA NYSE:BABA NYSE:BABA
showing very similar setup as all the US small caps. If you can decode this elliot wave mess I made, you can decode anything.
1. Right at volume shelf
2. Higher low showing a small timefrane second wave II
3. Ready to explode on to the third wave (3)
4. End goal of big wave 5 matches with the 50% retracement fib level from the previous high and low
Really hope timelines are shorter than this - I struggle with patience my friends
yieahh

Alibaba - This chart is pretty bullish!🎁Alibaba ( NYSE:BABA ) will head much higher:
🔎Analysis summary:
After we saw the perfect creation of the rounding bottom on Alibaba, the trend finally shifted back to bullish. Especially with the recent bullish break and retest, Alibaba is now preparing for another major move higher. All we need now is simple bullish confirmation.
📝Levels to watch:
$140
SwingTraderPhil
SwingTrading.Simplified. | Investing.Simplified. | #LONGTERMVISION

I'm long for $BABA earnings.NYSE:BABA has finally popped out of it's "TraderDaddy Triangle" to set the tone for a move up. Right in time for earnings it came back to retest the support level twice while coasting steady with the 20DMA. I'm looking at the $145 10/17 call with great Delta vs. Theta, With the profit take around $132.49 and leave a runner up to $143
BABA UpdateBaba initally broke out, but with USA China tarriff uncertainty and poor PPI the other day the market fell and BABA fell with it. A good amount of BABA shares were also unloaded. It's holding onto the .236 fib, and back in the wedge. We still have the large wedge and an inverse head and shoulders and with Earnings projected to be on the 26th, we may get another stronger breakout soon. Gaps to fill above and below of course, but we have a gap recently created and many more to fill up to the 130s and 140s. Bridgewater and some Saudi groups dropped their BABA positions, however Michael Burry is still in leaps and shares and so is David Tepper and Cantor Fitzgerald. Also plenty of strong call flow in general for september, october, and even 2027 calls added recently this morning. Despite the failed breakout, I'm leaning bullish on BABA. Looking to get to the .618 fib at 128.4 before further breakout. Nfa.
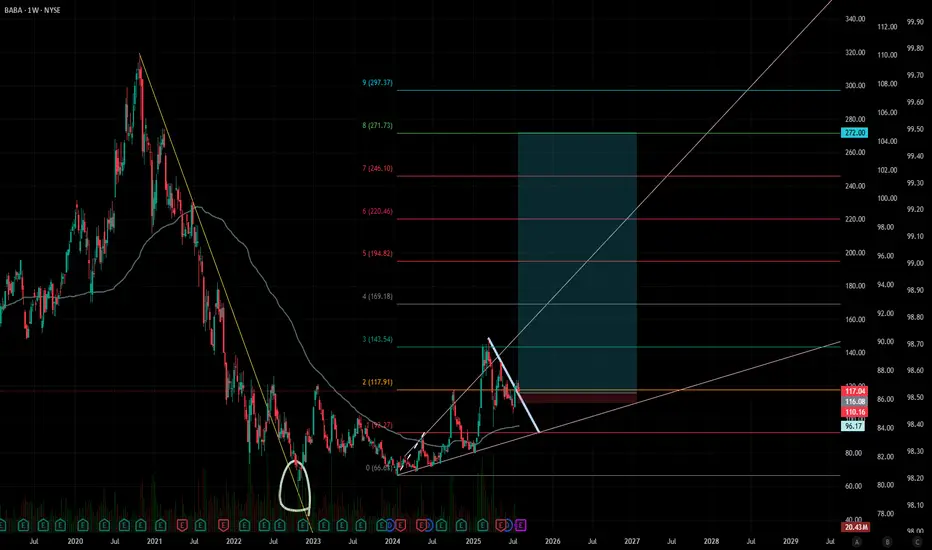
Alibaba’s Next Stop: $200Alibaba (BABA) is showing clear signs of strength as it trades around $126, confirming entry into a new bullish channel.
The stock rejected further downside at $95, a level that aligns with major resistance-turned-support zones from 2016, 2023, and 2024. This successful defense signals that market sentiment has shifted, laying the groundwork for a sustained move higher.
If momentum holds, BABA could rally aggressively into the $190–$200 range by November–December 2025, where a significant resistance zone from 2018 awaits.
Trade Idea: $BABA Long - China Tariff pause for another 90 daysProfit Target $150
Stop Loss $118.00
If this breaks out at this pattern, I will move the stop to 120.00
China's recent economic data shows resiliency despite Trump tariffs.
$BABA’s next big run starts very soonHuge rounded bottom breakout, retest and bounce has occurred. We are now flagging before the next run begins
Tightness and expansion on the 2M bolinger bands.
Weekly Bolinger bands are becoming very tight again. Explosive move to the upside this year (if not this Q)
Bet on Alibaba’s Resilience: Long Position for Next WeekCurrent Price: $120.36
Direction: LONG
Targets:
- T1 = $123.50
- T2 = $126.00
Stop Levels:
- S1 = $118.50
- S2 = $116.00
**Wisdom of Professional Traders:**
This analysis synthesizes insights from thousands of professional traders and market experts, leveraging collective intelligence to identify high-probability trade setups. The wisdom of crowds principle suggests that aggregated market perspectives from experienced professionals often outperform individual forecasts, reducing cognitive biases and highlighting consensus opportunities in Alibaba.
**Key Insights:**
Alibaba remains a central figure in China's tech sector and investor sentiment as it prepares for its upcoming earnings report. Key drivers include its cloud computing segment, international expansion, and strategic initiatives within its e-commerce division. Regulatory clarity in China has encouraged a more favorable outlook, giving the stock a boost of confidence over the short-term.
The macroeconomic landscape in China remains a key determinant of Alibaba’s valuation, as consumer spending ebbs and flows post-pandemic. Furthermore, restructuring updates within its business units could signal improved operational efficiency, an exciting development anticipated ahead of the earnings report.
**Recent Performance:**
Alibaba’s stock closed at $120.36 during the latest trading session, showing stability amid broader market fluctuations in the Chinese tech space. The stock has held up well despite sector volatility, a sign that investor confidence is improving. Key price levels in recent weeks suggest consolidation, but with the potential for an upside breakout looming as earnings approach.
**Expert Analysis:**
Market analysts express optimism for Alibaba due to its diversified growth opportunities. Its ongoing emphasis on cloud computing and international markets is particularly viewed as instrumental in driving long-term profitability. In light of these growth channels, and a strategic focus on innovation, Alibaba remains a high-conviction trade. Analysts do highlight short-term earnings volatility, but with positive expectations overall.
The forthcoming earnings announcements are expected to provide clearer visibility on restructuring plans and revenue mix allocation, both of which could trigger renewed investor interest in the stock.
**News Impact:**
Recent regulatory updates in China signal a more stable policy environment, reducing existential risks for large-cap tech companies like Alibaba. Additionally, heightened consumer activity post-pandemic and possible improvements in China’s macroeconomic indicators form a supportive backdrop. Any insights into Alibaba’s operational roadmap, whether in the form of expansion strategies or business restructuring announcements, are likely to provide a positive trigger for the stock.
**Trading Recommendation:**
Based on Alibaba’s recent stability, strategic growth initiatives, and potential earnings-driven momentum, a LONG position is recommended. Investors should target the $123.50 level initially, with a more ambitious upside of $126.00. Stops are defined conservatively at $118.50 and $116.00, ensuring downside risk is managed appropriately while leaving room for the trade to play out profitably.
BABA Long UpdateAlibaba Setup & Bullish Thesis
BABA remains held up in a low-volume node, which has historically acted as a headwind to price momentum. However, accumulation volume patterns are forming, and the weekly chart structure is in harmony with a move higher. Really likeing the breakout on the micro and holding it with an inside week candle, Clean break through 124 area with volume sends it, the first target is $150, with potential for $180+ if price can traverse the low-volume area above. Notably, this level aligns with major Fibonacci confluences, strengthening the technical case. Lets let earnings send it.
Fundamental Tailwinds
1. Strong AI Push
Launched Amap 2025, the world’s largest AI-native map platform
Entered the AI wearables space with smart glasses to compete with Meta, signaling ambition in next-gen consumer AI
2. Analyst & Investor Support
Analysts at Benchmark and Bank of America continue to maintain Buy ratings
Featured by Motley Fool and Zacks as a top stock to accumulate on pullbacks
3. Macro Tailwinds
U.S. easing chip restrictions benefits Alibaba Cloud and AI expansion
China tech rebound and the broader AI growth narrative are key catalysts supporting further upside
BABA WEDGEalthough baba has a gap to fill above and below, it's showing strength, wedging, volumes coming back in, and million in call flow were placed yesterday. It's been chopping tightly for a bit now on the daily chart on low volume, but as the volume is starting to come back in, earnings coming up, and other bullish sentiment, I'm leaning towards a BABA breakout soon towards the 130s. Nfa
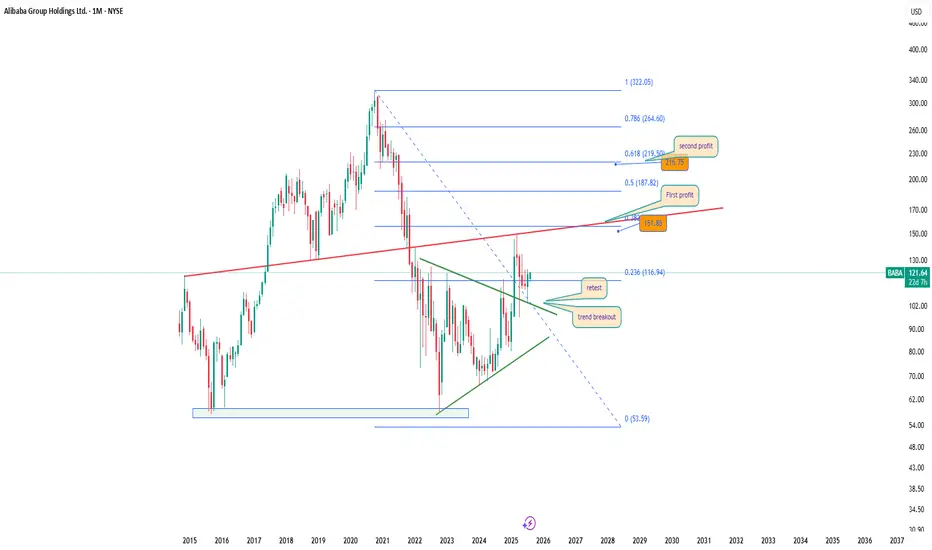
BABA 1M: Chinese favorite rising againTechnical setup:
Breakout from long-term triangle
Retest of trendline confirmed
Price holds above Fibo 0.236 (116.94)
First resistance: 151.85
Fibo targets:
→ 0.5: 187.82
→ 0.618: 219.50
Trade plan:
→ Hold after successful retest
→ Add on dips to 116–118
Targets: 151.85 / 187.82 / 219.50
Fundamentals:
Alibaba is restructuring around cloud and AI. Regulatory pressure from China is easing, and earnings are stabilizing. Buybacks and renewed institutional interest provide strong mid-term support.
Conclusion:
Alibaba may fall seven times, but rise eight — especially when Fibo and price action agree.
Baba - Waking GiantIt was trading at 300 levels during the 2020. Compare the EPS and sales with 2020 and 2025, there is a growth but the stock price has been trending down.
But from 2024, it has started the reversal and its trying to break the trend line.
Its 4th largest cloud provider world wide and its AI model Qwen gained traction with lots of downloads recently.
Target 1: 155$
Target 2: 210$
Stop loss: $90
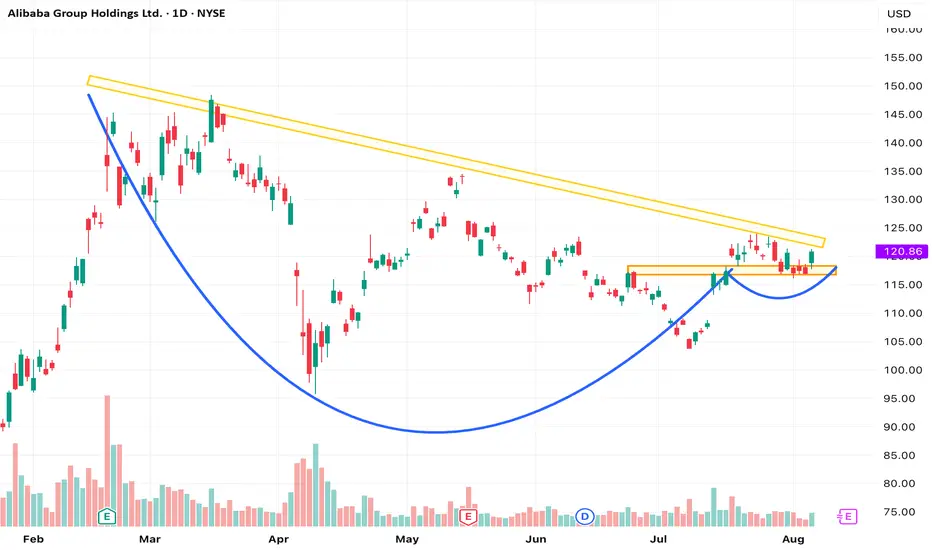
BABA – Cup and Handle Breakout with First HH/HLNYSE: BABA is forming a cup and handle pattern, with price breaking above the previous lower high, marking the first higher high and higher low in this potential trend reversal. Structure is turning bullish with momentum building.
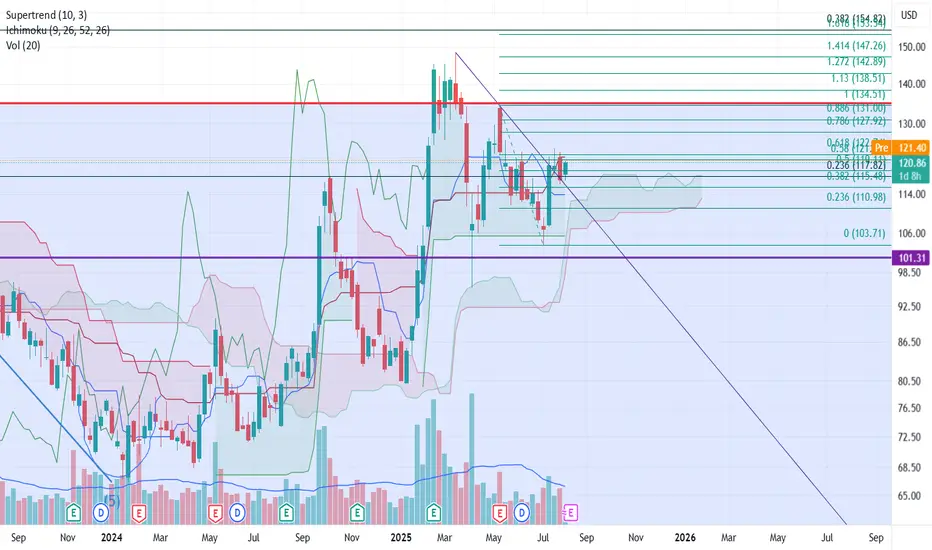
BABA - Livermore's Speculative Chart Method Analysis
📊 Analysis Summary:
BABA (Alibaba) weekly chart shows completion of a 2+ year markdown phase and is currently forming what Jesse Livermore described as an "Accumulation Cylinder." The stock is now approaching a critical "Pivotal Point" that could signal transition into a major markup phase.
🔍 Analysis Phases:
**Markdown & Accumulation Stage:**
- Clear downtrend established from late 2020 highs
- Late 2022: Capitulation bottom formed with volume spike (white circle), initiating the "Accumulation Cylinder" phase
- During this period, stock quietly transferred from weak hands to strong hands, building a solid foundation
**Pivotal Point - Current Situation:**
- Price has broken above the major downtrend line
- Currently showing bull flag/pennant consolidation pattern (white declining trendline)
- Decisive breakout above this consolidation resistance represents Livermore's "The All-Important Action" - the key confirmation signal for new uptrend initiation
**Markup Phase & Targets:**
- Successful pivot point breakout should trigger the primary "Markup" phase
- Fibonacci-based targets (Levels 1-9) map the potential upside trajectory
- Ultimate target: **~$272 level (Level 8)** based on this analysis
- Following Livermore's strategy: Hold positions while trend persists, reassess on meaningful corrections
⚠️ **Risk Management:**
Monitor for failure to maintain stepped progression pattern that Livermore emphasized as critical for sustained major moves.
**Disclaimer:** This analysis is based on Jesse Livermore's theoretical framework for educational purposes and is not investment advice. All investment decisions are your own responsibility.
#Livermore #BABA #SpeculativeChart #TechnicalAnalysis #ClassicTA
BABA Daily Trade SetupsIn this update we review the recent price action in Alibaba and identify the next high-probability trading opportunity and price objectives to target. To review today's video analysis clcik here!
