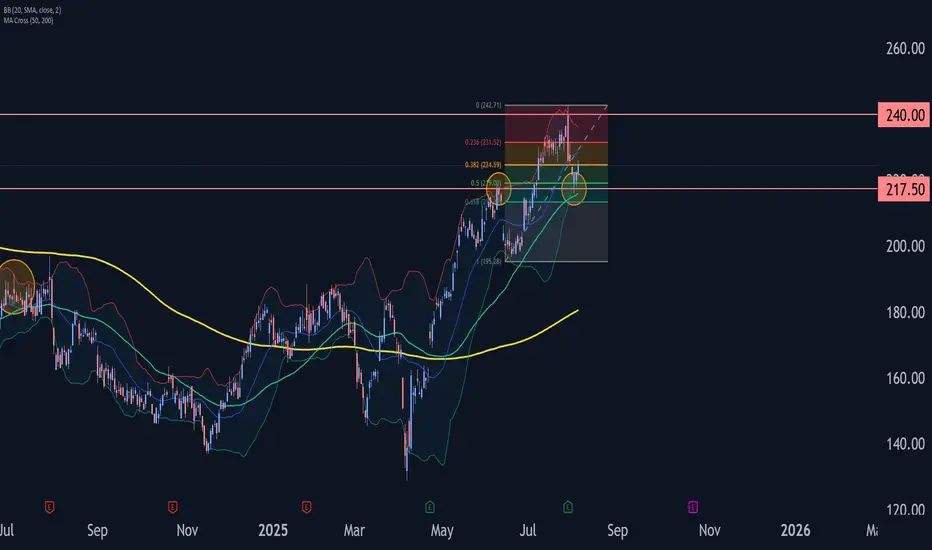
Boeing Wave Analysis – 5 August 2025- Boeing reversed from the support zone
- Likely to rise to resistance level 230.00
Boeing recently reversed up from the support zone between the pivotal support level of 217.50 (former top of wave 1 from June) and the lower daily Bollinger Band.
This support zone was further strengthened by the 50% Fibonacci correction of the upward impulse i from June.
Given the clear daily uptrend, Boeing can be expected to rise to the next resistance level 230.00 – the breakout of which can lead to further gains toward 240.00.
Trade ideas
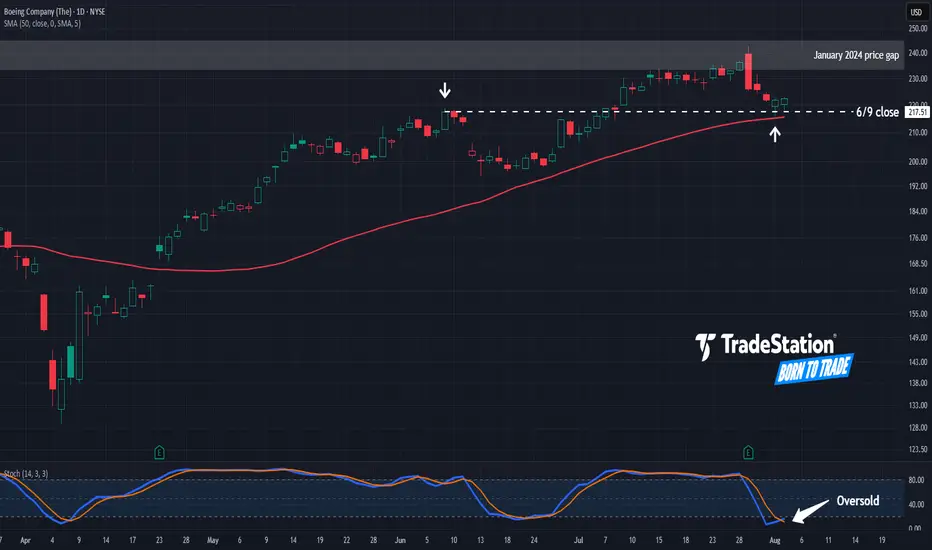
Boeing Has Pulled BackBoeing hit a 19-month high last week, and now it’s pulled back.
The first pattern on today’s chart is a price gap from January 2024. BA briefly entered that resistance area after earnings and revenue beat estimates on July 29.
Second is the June 9 close of $217.51. Sellers drove the aerospace giant to this old peak, where it’s now stabilizing. Has old resistance become new support?
Third, stochastics are turning up from an oversold condition.
Next, the 50-day simple moving average is rising from below. That may reflect a bullish intermediate-term trend.
Finally, BA is an active underlier in the options market. (Its average daily volume of 149,000 contracts ranks about 20th in the S&P 500, according to TradeStation data.) That may help traders take positions with calls and puts.
TradeStation has, for decades, advanced the trading industry, providing access to stocks, options and futures. If you're born to trade, we could be for you. See our Overview for more.
Past performance, whether actual or indicated by historical tests of strategies, is no guarantee of future performance or success. There is a possibility that you may sustain a loss equal to or greater than your entire investment regardless of which asset class you trade (equities, options or futures); therefore, you should not invest or risk money that you cannot afford to lose. Online trading is not suitable for all investors. View the document titled Characteristics and Risks of Standardized Options at www.TradeStation.com . Before trading any asset class, customers must read the relevant risk disclosure statements on www.TradeStation.com . System access and trade placement and execution may be delayed or fail due to market volatility and volume, quote delays, system and software errors, Internet traffic, outages and other factors.
Securities and futures trading is offered to self-directed customers by TradeStation Securities, Inc., a broker-dealer registered with the Securities and Exchange Commission and a futures commission merchant licensed with the Commodity Futures Trading Commission). TradeStation Securities is a member of the Financial Industry Regulatory Authority, the National Futures Association, and a number of exchanges.
Options trading is not suitable for all investors. Your TradeStation Securities’ account application to trade options will be considered and approved or disapproved based on all relevant factors, including your trading experience. See www.TradeStation.com . Visit www.TradeStation.com for full details on the costs and fees associated with options.
Margin trading involves risks, and it is important that you fully understand those risks before trading on margin. The Margin Disclosure Statement outlines many of those risks, including that you can lose more funds than you deposit in your margin account; your brokerage firm can force the sale of securities in your account; your brokerage firm can sell your securities without contacting you; and you are not entitled to an extension of time on a margin call. Review the Margin Disclosure Statement at www.TradeStation.com .
TradeStation Securities, Inc. and TradeStation Technologies, Inc. are each wholly owned subsidiaries of TradeStation Group, Inc., both operating, and providing products and services, under the TradeStation brand and trademark. When applying for, or purchasing, accounts, subscriptions, products and services, it is important that you know which company you will be dealing with. Visit www.TradeStation.com for further important information explaining what this means.
Beoing ShortBeoing is now net short on the regression break.
I am considering my EA options for his pair.

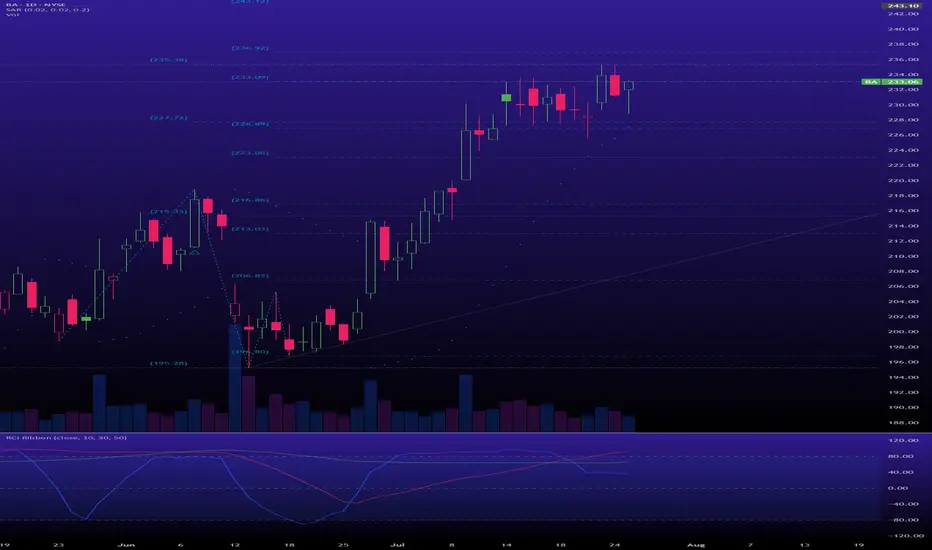
Boeing Company (BA) Long Setup Boeing Company (BA) Long Setup
Probable **Wave (5)** upside impulse from the recent \$225.26 low.
* Wave (4) looks complete — bullish structure shift starting from LL.
* Price is now breaking minor resistance, building momentum for continuation.
* **Demand Zone:** \$224.00–\$226.00 — proven bounce area, high-volume rejection
* **Supply Zone:** \$242.70–\$243.00 — last bearish engulfing + strong wick rejection
* RSI still recovering from **bullish divergence** on LL.
* **Entry:** \$227.75 (current consolidation near breakout)
* **Stop Loss:** \$224.00 (beneath recent low and demand)
* **Take Profit :** \$243.00 (supply zone)
* **Risk/Reward:** \~**3.0 R**
“In trading, the moment you think you’ve figured it out, the market humbles you.” – Mark Douglas*
#### ⚠️ **Disclaimer:**
This chart analysis is for educational purposes only and not financial advice. Always do your own research, manage risk, and trade responsibly.

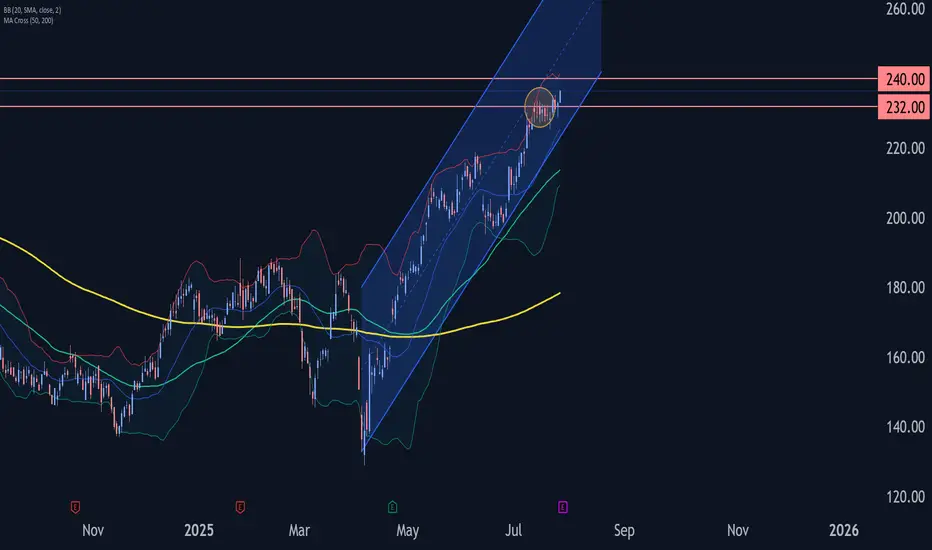
Boeing Wave Analysis – 28 July 2025- Boeing broke the resistance level 232.50
- Likely to rise to resistance level 240.00
Boeing recently broke the resistance level 232.50 (which stopped the previous minor impulse wave 3 in the middle of July, as can be seen below).
The breakout of the resistance level 232.50 continues the active short-term impulse wave 5 of the intermediate impulse wave (C) from June.
Given the clear daily uptrend, Boeing can be expected to rise further toward the next resistance level 240.00.
240c exp 08/15 for $BA its earnings report on TuesdayGiven Boeing's weekly chart is screaming 'to the moon' while the daily chart is just taking a breather, my money's on a bull call spread – because even a rocket needs to refuel before hitting warp speed
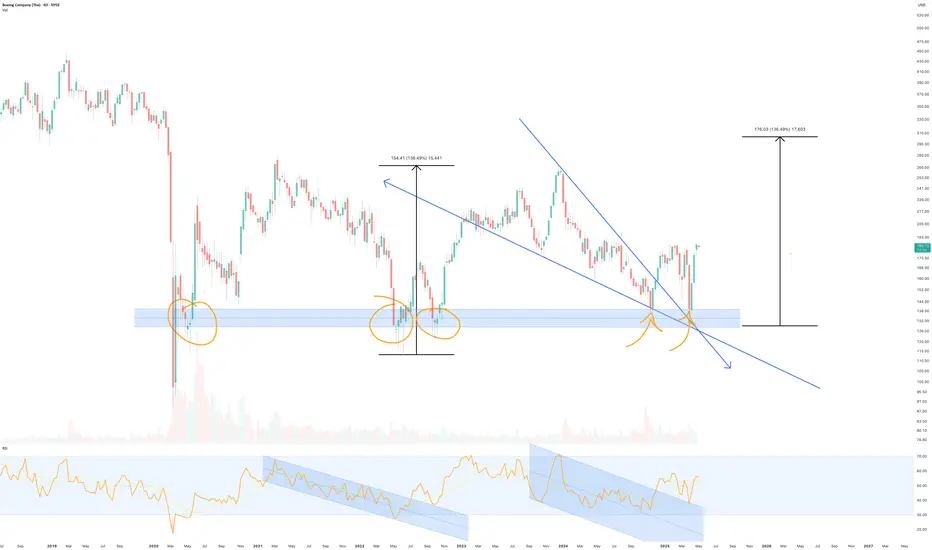
Boeing to $300 - Falling wedge** The year ahead **
On the above 6 day chart price action has corrected over 50% since December 2023. A number of reasons now favour a long position, they include:
1. Price action and RSI resistance breakouts.
2. Support on past resistance.
3. Double bottom on price action (yellow arrows)
4. Falling wedge breakout confirmation with forecast to $300 area
5. The Majority of other traders are bearish. Remember, trading has a high fail rate.
www.tradingview.com
Is it possible price continues to correct as others suggest? For sure.
Is it probable? No.
Ww
Type: Trade
Risk: <= 6% of Aerospace & Defence
Return: 60% from current levels
Stop loss: Will say elsewhere
Quantum's BA Weekly Outlook 7/19/25🚀 G.O.D. Flow Certified Trade Blueprint – Boeing (BA)
1. 🧩 Summary Overview
Ticker: BA
Current Price: $229.34
Trade Type: Day Trade / 0–2 Day Swing
System: G.O.D. Flow (Gamma, Orderflow, Dealer Positioning)
2. 🔬 Flow Breakdown
🔵 GEX (Gamma Exposure):
Highest negative GEX at $230 = possible resistance or sticky zone.
However, +GEX2 at $235 and +GEX3 at $240 outweigh $230 → suggests dealer hedging will push price upward through gamma bands.
🟡 DEX (Delta Exposure):
+DEX peaks at $230 then fades toward $240 and reappears at $250 → bullish flow decay confirms momentum needs volume through $235–240 to continue upward push.
🟣 Vanna:
Flip zone at $232.50 → if IV rises and price pushes upward, dealers must buy, adding tailwind.
Major positive clusters at $240 & $250 = major squeeze potential if IV increases intraday.
🔴 Charm:
Flip zone at $227.50 = above this level, morning decay benefits bulls.
Negative charm at $240 & $250 = expect afternoon fade into these zones — ideal trim targets.
⚪ Volatility:
Volatility decreasing weekly = less explosive risk, more structured/predictable flow.
Dealers will likely have cleaner hedging paths without IV shocks.
🟢 Open Interest:
Stacked calls at $230, $235, $240, $250.
Aligns with GEX/Vanna targets → confirms upside skew.
3. 🧭 Chart Structure Setup
Daily: Consolidation breakout attempt.
Hourly: Bounce off support with bullish stochastics crossover.
10M OR: Mark OR High/Low — use reclaim of OR High + VWAP as entry signal.
Resistance: $235–240 (flow + OI + chart confluence) = ideal trim zone.
4. 🎯 Trade Plan
Bias: Bullish
Trigger Entry: Break and reclaim of $232.50 (Vanna Flip)
Contract Suggestion:
235c or 240c, 0–2 DTE (Friday expiry if early week)
Stop-Loss:
VWAP loss or break below $230
Target Zones:
🎯 T1: $235 (GEX2 + OI cluster)
🎯 T2: $240 (GEX3 + Vanna/Charm confluence)
5. 🔁 Intraday Adjustment Triggers
If This Happens: Then Do This:
GEX flips positive above $232.50 Strengthen conviction
Vanna clusters weaken + IV drops Trim / De-risk
Charm flips heavily negative by 12pm Expect fade into highs
Large sweeps hit 235c/240c strikes Ride momentum with size confidence

Will Boeing experience a price drop with China buying Airbus?My experience in simulating the price from price growth to the diamond ceiling drawn in the Boeing analysis, I think we should expect the price to grow to the $224 price range in the short term!
Good luck!
MJ.REZAEI

BA: Possible breakout???Hello,
BA is possibly breaking out of multi year structure.
If it comes down and retest the resistance as support and go higher, it can go ballistic.
Be cautious about fake breakouts.
Happy trading. NYSE:BA
BA heads up into $230: Strong fib zone might cause a serious dipBA has been flying (lol) from its last crash caused crash.
About to test a signrificant resistance at $229.82-230.73
Expect at least some "orbits" or a pullback from this zone.
.
Previous analysis that caught THE BOTTOM:
==================================================
.

BOEING COMPANY STOCK ENTER INTO BULLISH TREND Boeing Company Stock Enters Bullish Trend on 1-Day Time Frame
The Boeing Company (BA) stock has entered a bullish trend on the 1-day timeframe, signaling potential upward momentum. A key development in this trend is the recent breakout above the critical resistance level of $189.00, which now acts as a support zone. This breakout suggests strong buying interest and indicates that the stock may continue its upward trajectory in the near term.
Bullish Outlook and Price Targets
With the resistance level breached, Boeing's stock is expected to maintain its bullish momentum. The next major target on the upside is $265.00, which could be tested if the bullish trend sustains. This level represents a significant psychological and technical resistance point, and a successful breakout above it could lead to further gains.
Key Support Level to Watch
While the bullish scenario appears strong, traders should remain cautious of potential pullbacks. The $130.00 level serves as a crucial support zone. If the price retraces, this level will be critical in determining whether the bullish trend remains intact or if a deeper correction could occur. A break below $130.00 may signal a shift in market sentiment, but as long as the price stays above this level, the overall bullish structure remains valid.
Conclusion
Boeing’s stock has shown strength by breaking above $189.00, reinforcing a bullish outlook. Traders and investors should monitor the price action around this level for confirmation of continued upward movement. The primary target remains $265.00, while $130.00 serves as a key support in case of a downside move. If the momentum holds, Boeing’s stock could see further gains in the coming sessions.

BOEING READY TO FLY?NYSE:BA is a fundamentally mismanaged mega-cap...
But for a trade, this weekly wedge breakout looks ready to fly.
Yellow Lines = Gap Fill Price Targets
Fasten your seatbelts, this could explode.
Pun intended.
- READ THE CHARTS 7/5/2025

Boeing - Eyeing a recovery soon?NYSE:BA is back to the upside and has been trending upwards since early April 2025. Price action saw the stock is back into action after filling up the bearish breakaway gap. Now it is waiting to break the key resistance above 220.00 to further confirmed the upside.
Meanwhile, Ichimoku is showing uptrend intact, just short of a three bullish golden cross. As conversion and base line is flat and leading span -A just turned flat.
Long-term MACD is rising steadily, indicating the long-term bullish momentum is sustaining well.
Stochastic saw overbought crossover but chart is showing weak correction and selling pressure was almost non-existent.
23-period ROC dips but remain positive.
Directional movement index confirms the bullish strength is still intact.
As short-term momentum and volume shows decline, there is a risk of correction hence we prefer a buy stop above 220 OR a pullback to nearest support at 189.54.
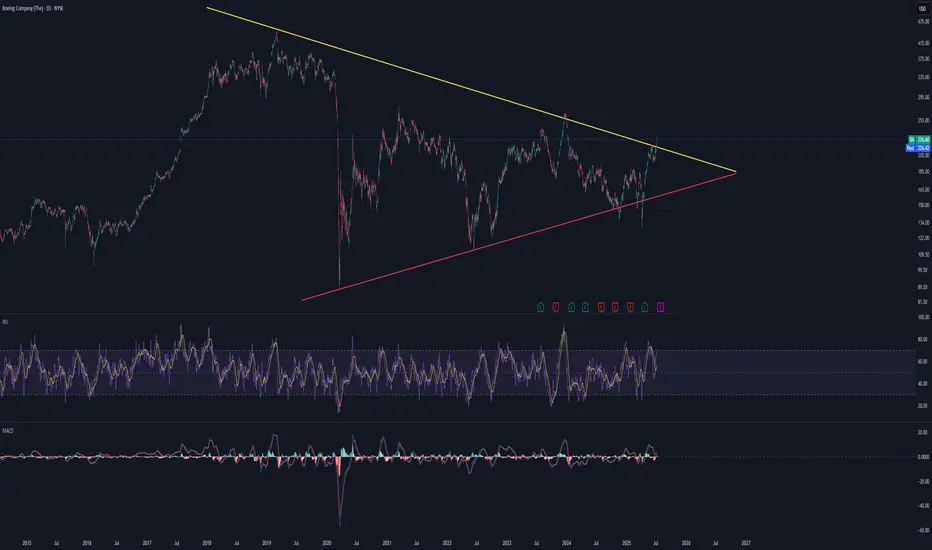
Weekly chart shows 5-wave symmetrical triangle and we expect prices to continue to have a strong bullish continuation over the longer-term period. EMA analysis shows trend is back to the upside and 14-period RSI shows steady uptrend momentum.

BOEING STOCK PRICE CONTINUING IN BULLISH TREND BOEING STOCK PRICE CONTINUING IN BULLISH TREND.
Stock is currently trading in bullish trend in 1 hour time frame.
Forming higher highs and higher lows.
Secondary trend is expected to end.
Bullish engulfing candles shows the strength of buyers in the market.
Price is expected to remain bullish for upcoming sessions.
On higher side market may hit the target price of 216$
On lower side, market may test the support level of 204$

Short-term BA Short - Gap Fill OpportunityHey y’all —
Sharing this idea a bit late, but I believe there’s still more downside to capture.
Last Friday’s massive pump on BA closed the gap on the daily timeframe. Based on the current structure, the chart suggests a likely move to close the lower gap as well. I entered around the checkered flag area last week, targeting the gap fill zone between $202–204. Given the price action, there's a high probability of a further dip to fully retrace the recent move up.
Near-term take profit target: $202–204
If that range breaks: $187–183
I’m currently holding put options with a September expiration.
Thanks for checking it out!

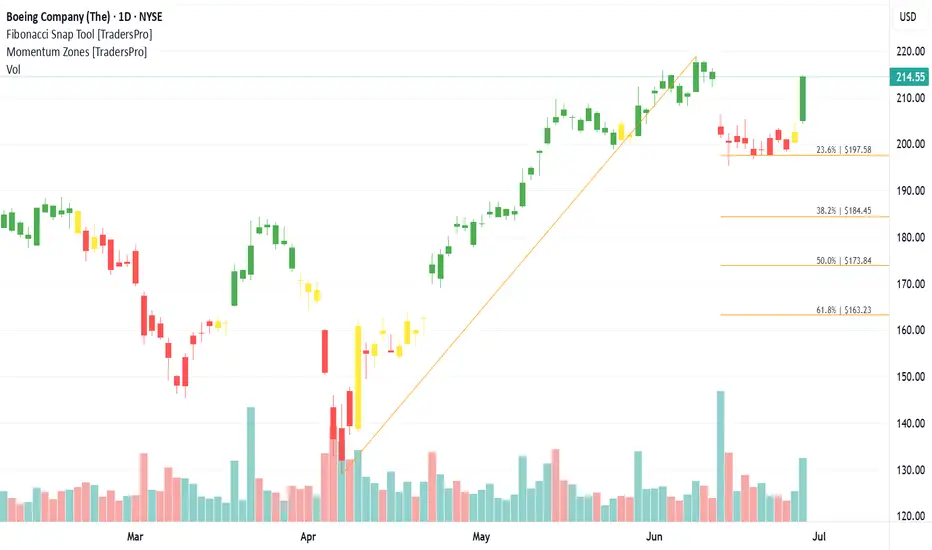
Boeing Company (The) (BA) Powers Global AviationBoeing Company (The) (BA) is a global aerospace leader, manufacturing commercial airplanes, defense systems, and space technology. With iconic aircraft like the 737 and major contracts with governments worldwide, Boeing plays a key role in global aviation and security. The company’s growth is driven by rising air travel demand, defense spending, and long-term investments in space exploration and next-gen aircraft.
On the chart, a confirmation bar with increasing volume shows strong buying interest. The price has entered the momentum zone by moving above the .236 Fibonacci level. A trailing stop can be placed just below that level using the Fibonacci snap tool to help manage risk while staying positioned for upside.
BA, Boeing1. Higher Timeframe Context
Price is currently trading within a well-defined higher timeframe supply zone between 214–218, which previously acted as a major distribution area. This zone aligns with a prior bearish impulse leg and represents unmitigated institutional sell-side interest.
2. Current Price Action
On the 15-minute chart, price has aggressively rallied into the supply zone with low retracement, suggesting an imbalance created by passive sellers.
The move into this zone has occurred without a clear internal structure shift to the downside yet, but early signs of exhaustion are evident.
There's a visible cluster of equal highs around 218, indicating resting buy-side liquidity that smart money may target.
3. Liquidity & Market Structure Outlook
We anticipate a liquidity sweep of the highs at ~218, which is typical when price revisits a premium zone filled with uncollected orders.
The projection is for a short-term rejection or distribution reaction from current levels, which could lead to a retracement into the newly formed demand zone at 208–210.
This area represents a bullish order block, which could act as a reaccumulating point before a continuation to the upside.
4. Trade Planning Framework
Short Bias (Reactive Play):
Look for signs of lower timeframe distribution, such as a break of internal structure or supply engulfing at 214+.
Potential target: 208–210 zone for partials or full exit.
Long Bias (Continuation Play):
Upon reaction from 203–205demand, anticipate bullish PA such as a CHOCH (Change of Character) or BOS (Break of Structure) on LTF.
Entry on confirmation (e.g., bullish engulfing or mitigation entry).
Target: 218+ liquidity sweep zone.
5. Risk Management Considerations
Avoid blind entries within the resistance zone; confirmation is key.
Size positions based on RR parameters (minimum 1:2) and predefine invalidation levels—especially in the short scenario, as failure to reject this zone could lead to a breakout.
Be aware of potential news catalysts or macro events that may add volatility to BA during the setup period.

Boeing (BA, 1W) Falling Wedge + H-Projection TargetOn the weekly chart, Boeing has formed a classic falling wedge — a bullish reversal pattern that typically signals the end of a correction phase. After a sharp decline from $267.97 to $138, price action began to compress within a wedge, forming lower highs and higher lows on declining volume — a textbook setup for a breakout.
The structure remains active: a confirmed breakout above the upper wedge boundary, with a retest near $181.60 (0.618 Fibonacci retracement), would validate the pattern and trigger the next upward phase.
The projected move (H) equals the height of the previous impulse — $130.02. Adding this to the base of the wedge (~$138) yields a technical target of $268.00, aligning with the previous high and completing the structural recovery.
Technical summary:
– Multiple confirmations of wedge support
– Volume declining into the apex (bullish)
– Entry zone: breakout + retest at $181.60
– Mid-level resistance: $198.09 (0.5 Fibo)
– Final target: $267.97–$268.00 (H-projection complete)
Fundamentals:
Despite operational setbacks, Boeing remains structurally positioned for recovery as demand for commercial aircraft rebounds. Additional support could come from improving supply chains, increased defense contracts, and a more dovish outlook from the Federal Reserve heading into 2025.
A breakout above $181.60 and sustained momentum would confirm the falling wedge pattern and activate the H-measured move toward $268. This is a structurally and fundamentally supported mid-term recovery setup

BOeing ShortBA is now net short on the regression break.
I am considering the correct EA for this trade. With higher oil, the airlines will be effected directly.

[$BA] Boeing's black friday?NYSE:BA
Quick-Take
Unfortunately, an accident occured with a Boeing Dreamliner 787 in India.
This triggered a 'small crash' in the stock as well, due to Boeing's (ongoing) raising concerns for quality and safety.
However, we should see it as chance for a potential swing-trade of 7 days.
⭕ Risks
The analysis of the plane crash will take a couple of days and there are even rumors about an 'external factor' being the reason for the plane to fall from the sky.
Eitherway: Volatility is a two-edged sword that we should utilize to our advantage.
🟢 Pros
The Iran/Israel conflict is escalating, that led to a spike for a Defense companies such as $ NYSE:LMT XETR:RHM . But NYSE:BA takes also part of the military-industrial complex that should profit of the bad times in geopolitics.
📏 Position
We position ourselves bullish via options:
-> buy Call-Options (long-call or bull-call-spreads)
-> sell Put-Options (short-put (cc) or bull-put-spreads)
What do you guys think?

[$BA] Boeing's black friday?NYSE:BA
Quick-Take
Unfortunately, an accident occured with a Boeing Dreamliner 787 in India.
This triggered a 'small crash' in the stock as well, due to Boeing's (ongoing) raising concerns for quality and safety.
However, we should see it as chance for a potential swing-trade of 7 days.
⭕ Risks
The analysis of the plane crash will take a couple of days and there are even rumors about an 'external factor' being the reason for the plane to fall from the sky.
Eitherway: Volatility is a two-edged sword that we should utilize to our advantage.
🟢 Pros
The Iran/Israel conflict is escalating, that led to a spike for a Defense companies such as NYSE:LMT XETR:RHM . But also NYSE:BA is part of the military-industrial complex that should profit of the bad times in geopolitics.
📏 Position
We position ourselves bullish via options:
-> buy Call-Options (long-call or bull-call-spreads)
-> sell Put-Options (short-put (cc) or bull-put-spreads)
What do you guys think?

Yesterday was bad for BOEING CompanyYesterday was bad for BOEING Company.
This stock has been fighting to recover from the many challenges it has faced lately, and here comes the India news.
The stock (BA) experienced about 5% drop before its recovered a bit.
It is trading at about $203, but if it breaks the trendline on the chart and the $200 support zone, we might see it go downhill a little more.
I will be happy to buy using DCA strategy from $193 - $186 zone.
Trade with care.
Please, if it is helpful, follow me, like, comment and share
