A DAL Story IdeaJust a story I told myself. So it is more of a story than a mathematical calculation to predict the future.
Trade ideas

growthSeems it will continue to rise sharply until it is back at its "before COVD-19" price ($50-60) then continue to slowly grow. Would never sell it, just invest more because of the good dividend payout

Delta Airlines Post COVID 19 thoughts June 2020If looked from the perspective of Fibonacci... chances are DAL prices during COVID 19 align with a 78% retrace line. Those also seem to match resistance around the initial trading values of this stock.
There is a good chance that during June and follow on months, this price will continue to grow and test the $50 price. At least from my perspective. Whether if it only tests the $50 to later come back down or just go back to previous price ranges, there may be a profit benefit here. The next months behavior really depends on what is going to happen around the Pandemic itself and associated travel restrictions. As well as how humans may fear traveling in the short term. It seems that a buy at current price range may reward with short term growth. If it happens, it can potentially be protected with a sell limit in case prices fall again.
Another strategy may be to buy and just sell with the price hits the $50 range. It'll all depend on each individual's preference: Do you want the shares for the long term (and take advantage of current bargain prices)?; Or do you want to profit with volatility?


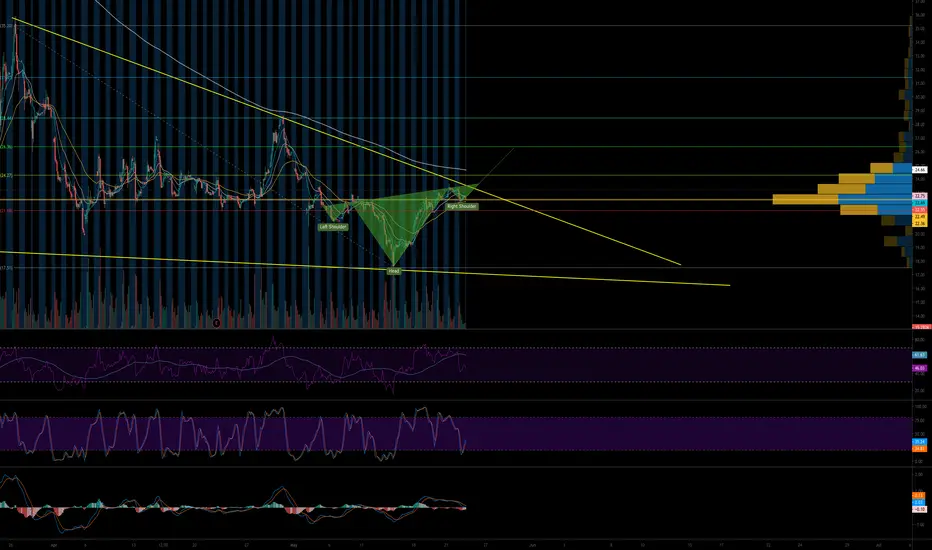
DAL forming H&S patternThe DAL is forming H&S pattern. Watch for breakout..
Disclaimer: This is not an advice to Buy or Sell

My Analysis for DELTA AIR LINES INC, a Bullish move is startingHi Traders, I'm sharing with you my vision concerning DELTA AIR LINES INC, the downtrend has come to an end, now place for a big uptrend move , It's the start of a bullish big move , waiting for your comments and remarks guys, good luck for you all :)


Delta Airline - Technical AnalysisDelta Airline - The idea is to go long.
Wait if there will be a price return/retracement up to the trendline before buying

Delta Airlines key level on $24Delta is a buy.
Price action suggests not only having bottomed, but is already recovering.
As long as $24 holds, Delta is a buy.

Dal LongI see a buy trend here on this stock, but there is down side risk as well. Lots of posibilities to recover but i don´t know which way heading for.

DAL: Potential Short Term Bullish Reversal 1M, 1D (Jun. 01)X Force Global Analysis:
In this analysis, we take a purely technical approach to Delta Airlines (DAL), exploring signs of the stock being oversold, as well as potentially bullish reversal signals demonstrated on the monthly and daily charts.
Monthly Chart
- On the monthly chart, we have counted clear Elliott Waves
- Since 2015, Delta Airlines has been forming a bearish rising wedge pattern
- Moreover, we could spot an extended bearish divergence, with prices forming higher highs, while the indicators formed lower highs
- The Relative Strength Index (RSI) formed lower highs, as well as the Moving Averages in the Moving Average Convergence Divergence (MACD)
- Within the bearish ascending wedge, we could count Elliott Triangle Waves (ABCDE), leading to a breakdown triggered by the Corona Virus (Covid-19)
- Currently, technicals demonstrate that the stock is oversold, and under extended.
- The RSI demonstrates that DAL is at oversold regions
- The MACD shows historical bearish histograms
- However, despite the huge bearish pressure, we can also see signs of a short term potential reversal through candlestick patterns
- The current candle is forming a dragonfly doji candle, in which we see a long lower tail, and a small upper tail, with the candle close close to the open value
- Combining this with Elliott Waves, it could be said that we are in a downtrend counting Elliott Impulse waves (12345)
- This dragonfly doji candle could be the start of a short term trend reversal for wave 4
- While we have failed to break and close above the 0.618 Fibonacci retracement support, it's important to note that we have secured a historical support at $22.45
Daily Chart
- When we zoom into the daily chart, we see clearer signs of a short term bullish reversal
- We have been consolidating within a bullish descending wedge pattern after a severe drop
- Prices have broken out of the falling wedge, as we are seeing a small pullback
- We can also spot a clear bullish divergence, with lower lows on the price, and higher lows on the indicators
- The RSI demonstrates great strength, trading at neutral levels
- The MACD also shows that the trend is backed by momentum, as it creates a steady uptrend without any death crosses
- We can spot a lot of gaps ranging from $20 up to $56
- Despite the high trading volume, the current range starting from the drop was extremely choppy
What We Believe
Combining the evidence suggested in the daily chart with the analysis of the monthly chart, a probable case would be a further rally up filling the upper gaps at $30 ranges, completing wave 4 on the monthly. From that point, we could see further correction, filling the gaps located below the current price, before we see a mid-term trend reversal leading to a bullish rally to fill the gaps above. While it's important to also take into consideration the fact that Delta Airline's fundamentals have also been heavily affected by Covid-19, technical demonstrate a high probability for a short term bullish trend reversal.
Trade Safe.

Short from down trend and risk off for stocks acc. trade warShort from down trend and risk off for stocks acc. trade war

Delta bounce or breakdown at $24?I dont know where this is going yet but I think it will be interesting to watch how Delta moves around the $24 area. Might be some good weekly options bets lining up here for anyone trading this stock.


Wyckoff MethodDelta has been undervalued since they haven't been able to perform as per usual. It may be a while before they continue business as usual. They will be able to bounce back as one of the Domestic Airlines. I am more interested in Domestic since other countries may want to keep a hold on the spread of the Virus by preventing international flights.
Overall this is the BOTTOM considering they have been cutting flights by 95% this is literally their minimum capacity. There is only up from here. Not only that but a familiar pattern has risen to rear its head. Wyckoff method. If it is the Wyckoff method it will test that first line again by the end of next week.
Even if it doesn't I still think this is a good buy signal. Delta is in a great position to grow from here so long as there isn't a second wave of breakouts with the virus.

$Dal - profit taking is near?RSI over 72 (bearish)
MACD: Repeating pattern from April 29
SMI Rolling over at 1 month highs
Would not be surprised if it dropped back into the lower gap or bounce off of it before testing upper gap.
I don see a lot of reward for airlines at this level. Will most likely wait for entry in the 30's.

America’s #1 Airline - Delta LongLadies and gentlemen please stay in your seats until we reach 20,000 feet 😄

Delta Airline - Technical AnalysisThe breakout of the top trendline and the stochastic might suggest a buy signal (Check France -KML Airlines , Ryanair , - all European company that have opened high, as well as LSE:IAG .
Perhaps, Delta will do the same.


DAL - Swing to $26The right shoulder on the reverse H&S may have bottomed. It's important to note that the neckline is tilted on the upside, so I'm giving the bullish case extra weight. There's the 200 in the way and a trend line since the initial recovery, but with states easing, I think we can see it bump to $26 in the short term. Like I said, however, lots of things in the way so exercise patience and wait for confirmation because we're still in a bearish trend overall.