DocuSign falling more than 30%DocuSign's price plummeted more than 30%, after publishing Q3 results. Docu posted beter than expected Q3 results, but the CEO said that the pandemic boom appears to dissipate. The company’s billings and revenue forecast missed expectations. Right now the price is back to 2020 June levels..
DocuSign, Inc. Shs Cert Deposito Arg Repr 0.0454545
No trades
Trade ideas

$DOCU with a big gap down after earnings...There is a weekly closing gap at 161.42 and below there is 150.60. If there is more bearish price action, these could be targeted by sellers.


Beautiful rejectionif you can read a chart this looks lovely...
Multiple confluence on the weekly chart here

DocuSign buy zoneDocuSign is currently sitting in a great buy zone, with a lot of volume and potential to shoot the price upward !
Potential gains 10-15% in upcoming days

DOCU potential grpwth to 300-320Touched a demand zone, where we could see potential reversal.
Entry price - 278
Stop-loss - 274
Target Price - 300-320
Size - 5% of the capital
Period 4-6 weeks.

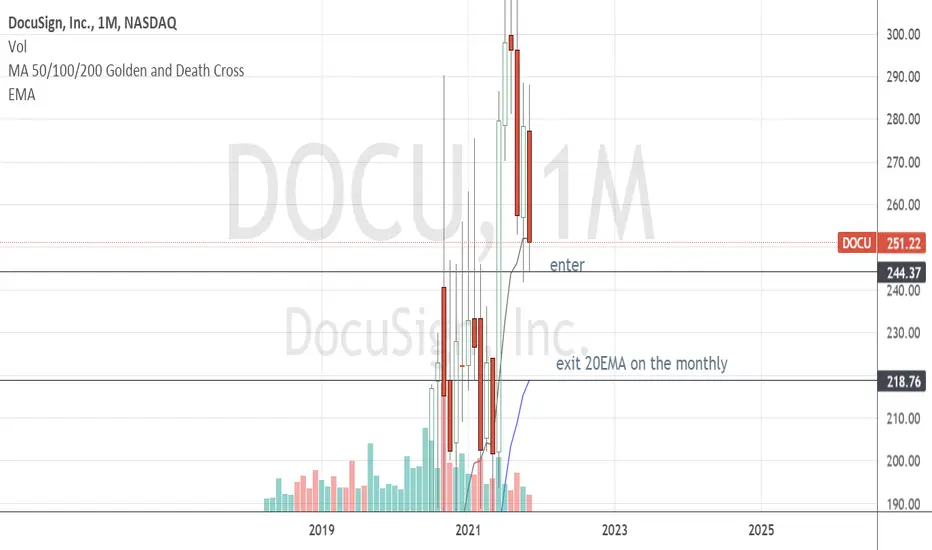
DOCU - trade setupI like this setup on the downside here. Next support is the 20EMA on the monthly chart. Wait till it breaks the enter line before you get in. Very nice risk reward on this one.

The next runner after ER - $DOCUChart says it all.
Symmetrical triangle and retest of prior resistance which was swiftly bought up.

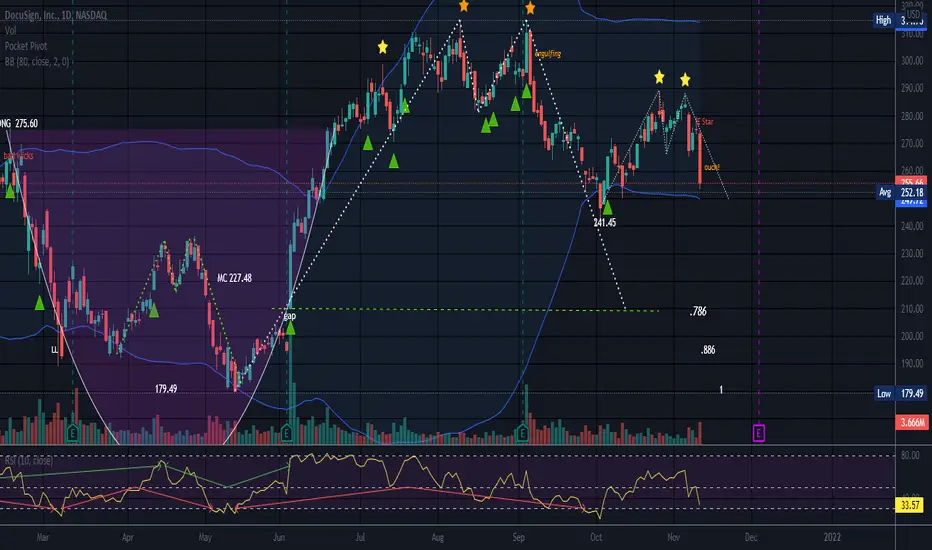
Earnings 12-2 AMCThe Evening star is a bearish candle pattern. This one is an evening doji star. The performance of this star as a bearish reversal is not great in a bull market, but you can usually expect a really bad red candle for at least the next day, even in a bull market. Whether the downtrend continues is up to Mr. Market. This is not a common candlestick pattern. It iss not seen on a regular basis like Haramis and Engulfing candles.
The evening star is a 3 candle pattern and is preceded by a decent sized green candle body. It is followed by a decent size red candle and the evening star is above both of these candles.
DOCU is being rejected on each rally up as it pushes to go higher. The top is not a pretty site.
DOCU has been unable to surpass former highs and price seems to lose momentum after each attempt to go up.
Negative volume remains high for DOCU showing interest. Short interest is around 3.65% with 3.3 days to cover.
No recommendation.
$DOCU breakdownAnother case of hot stock from yesterday that is breaking down. Possibly the bullish case is over here, maybe earnings surprise will save it but I doubt. It's time to ride it down.

Docusign double topThese covid stocks will pull back in the next couple of weeks in sympathy with Pton guidance announcement.
Docu fell significantly Friday but bounced off fibonacci support at 264.
Our trendline now aligns with that fibonacci support at 264 so a drop beneath that number would be a break beneath 2 crucial supports. Friday closed on high selling volume, let's see if it was an over reaction to pton news or is there some follow through.
Short entry
263
stop loss 264.50
Target 203 (Gap close)

DOCU RoundDOCU is showing an upward round trending formation and held the moving averages with a green doji candle. Looking to continue the upward momentum before earnings are reported. A break below todays low would indicate a break in trend

DOCU Short setup 10/25/21Shout out to @ChartGalDinz for this setup on DOCU. Looking to enter at a break 0f 273 with a tight stop at the hourly lower high. Target 1 is at the 268 lvl

Long $DOCU CMP $271.16Long $DOCU CMP $271.16. Though trading below 50 EMA. I am expecting it to bounce back from $260-270 range to major Fibonacci support level $293. Watching price to reclaim 50 EMA. Fading negative MACD histogram. Possible Target $310

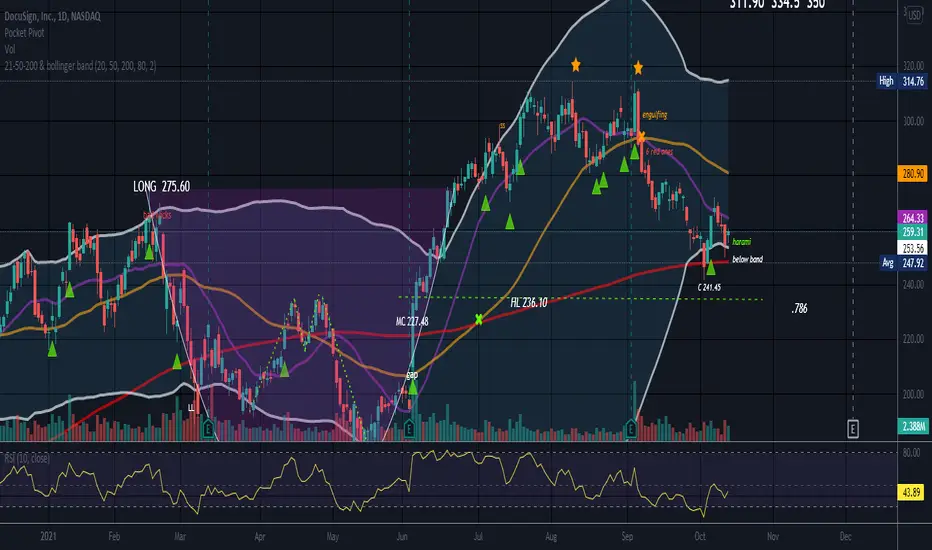
Cup and HandleCup and handle pattern but also see an ABC bullish pattern and C is marked.
Price went below bollinger band set on 80 and was also oversold at that juncture. If price is above the bands on this setting it is usually overbought and vice versa. Price eventually returns to the bands.
Monthly candle is a green long legged doji so indeterminate.
Mid cup can be a strong level of support if all else fails. The handle low can also be support. Mid cup is 227.48 Handle low is 236.10 and C is 241.45 and all can serve as support.
Negative volume had slumped recently but there is a smart money footprint, a pocket pivot, below price (green triangle)
Very bearish string of red candles coming down but sometimes this can flush out sellers. When most are gone, buyers can appear.
Bullish harami today but needs confirmation. Price is under the 50 and the 20 and teetering on the 200. The 200 SMA continues to slope up.
No recommendation.

Docu 4H shorthead & shoulders and a lot of divergences between indexes, decreasing volume buyers, bulls beware

Awaiting Clear confirmationMy theory on this stock is as follows
- strong buy rated stock with a long term positive outlook
- clear channel boundaries that have been respected excluding a large sell off
- Evidence it is bouncing off the previous range before the sell off
- Last weeks candle and hopefully this weeks candle show a clear indecision in the market (hammer pin bar or something similar) alongside last weeks candle would be fantastic.
My bias would be to go long.
If your view is long term my theory is this trade will be correct.

$DOCU with a Bullish outlook following its earnings #Stocks The PEAD projected a Bullish outlook for $DOCU after a Negative Under reaction following its earnings release placing the stock in drift A.
If you would like to see the Drift for another stock please message us. Also click on the Like Button if this was useful and follow us or join us.

9/20 DOCU(1) DOCU touched the support
(2) volume came in last week and last friday
(3) weekly chart looks ok for far

DOCU Breakout$DOCU power of three play with all ema's stacked together. Positive earnings reaction. Targeting 1.618 fib extension.
Trigger: Price > $314.5
Target: $325
Trade Vehicle Options (2-4 weeks out):
9/17 $325C @ $3.60
9/24 $325C @ $5.35
10/1 $325C @ $7.50

Long $DOCU CMP $299.13Long $DOCU CMP $299.13. Good consolidate from last few days. Forming flag. Above all moving averages. Possible target $315 in coming days
