Ford Motor Company Shs Cert Deposito Arg Repr 1 Sh
No trades
Trade ideas

$F Ford… It’s Not Going to StopI cannot stress enough how much Ford is undervalued right now. They report earnings on April 27 and forward guidance that for the first time will include their new Ford lightning truck EV

Ford's Stock continues drive north In this key trend.Ford reversed into an uptrend on April 7, following a 43.72% decline that brought the stock down from its Jan. 13 high of $25.87 to a low of $14.56. Ford confirmed the uptrend on April 13, when the stock printed a higher low at the $15.22 level.
If Ford closes the trading day near its high-of-day price, the stock will print a bullish engulfing candlestick on the daily chart, which could indicate higher prices will come again on Tuesday. Bullish traders would like to see Ford close the trading day above the most recent high of $15.77, which will cause the stock to print a higher high to confirm the uptrend is still in play.
Ford has a gap above on its chart between $18.59 and $19.87. Gaps on charts fill about 90% of the time, which makes it likely Ford will trade up to fill the empty range in the future.
Bullish traders will want to see Ford rise up above the 200-day simple moving average (SMA), which is trending near the $17 level, in short order because on Friday the 50-day SMA crossed below the 200-day, which caused a death cross to occur. If Ford can rise up above the 200-day quickly, it will cause a golden cross, which would give bullish traders more confidence going forward.
Ford has resistance above at $16.45 and $17.02 and support below at $15.51 and $14.34.

Ford confirms test of supportFord recently tested support both near term and longer term.
Price action has also broken a counter trend line to signal a potential reversal.
Price closed 1%+ on a weekly basis above the area of support it recently tested.

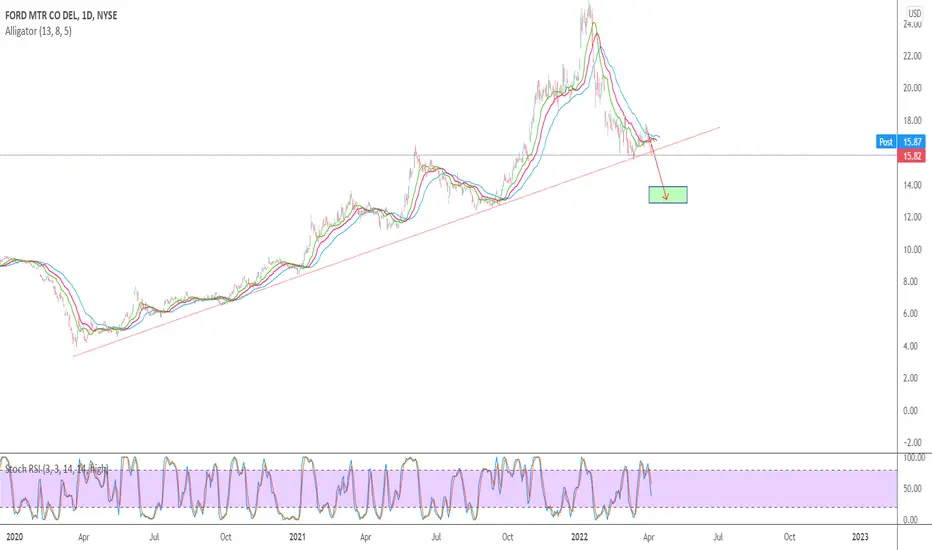
F possible rejection by 9maF shorting it off the 9 ma rejection. Risking off of $16 and looking for $12.50 target.


Ford - Similar Indicator Situations Using these different places in time, yet similar structural features using this indicator, conclusions can be drawn about how price will progress on this Monthly timeframe
It looks bullish, hard/impossible enter into a trade on this timeframe, I am just demonstrating an indicator

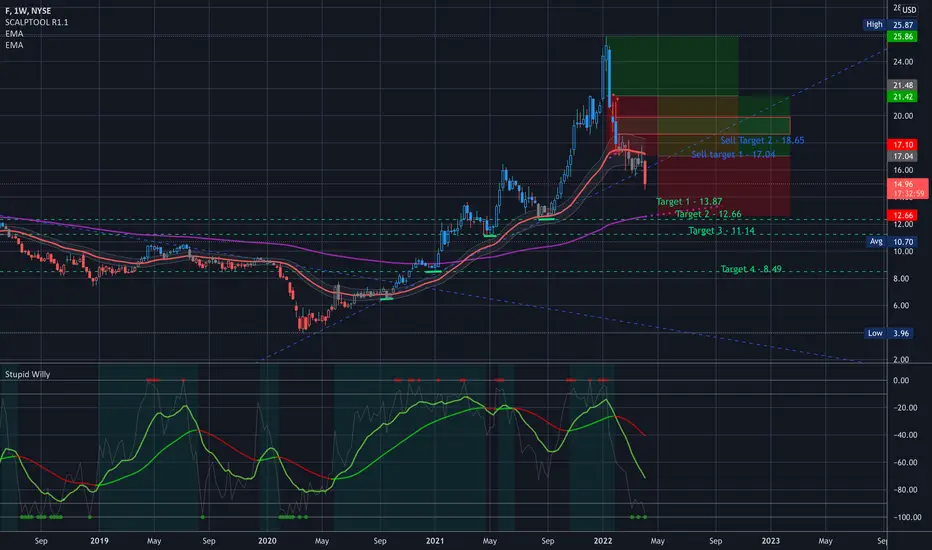
$F Key Levels, Analysis, & Targets$F Key Levels, Analysis, & Targets
Dang… I wish I followed up with my own plan from when I posted last (which I will post below)… because that would have made a great short. So then for now let’s do a long swing… These are my next targets
Swing setup
1 at 13.87
1 at 12.66
2 at 11.14
4 at 8.49
(Then multiply by your multiplier (x5, x10, x100, x1000, etc to find your position size)
------
---
I am not your financial advisor. Watch my setups first before you jump in… My trade set ups work very well and they are for my personal reference and if you decide to trade them you do so at your own risk. I will gladly answer questions to the best of my knowledge but ultimately the risk is on you. I will update targets as needed.
GL and happy trading.
IF you need anything analyzed Technically just comment with the Ticker and I’ll do it as soon as possible…
Ford ($F): Continued Downside Toward Discount TerritoryFord Motor Company has had a spectacular run up since the lows of March 2020. The company value appreciated 600% in the months after COVID was first announced and lockdowns started. Two years later, and it appears F has made a high at 25.87 and broken bullish market structure below 18.60.
I am looking at continued down side to 15.50 followed by retracement back to 20.00 level before downside continues to fairer value. My short objectives are 15.50, 12.40, 11.15 and 9.50 price levels.


$F - Can the trend line hold?Ford bounced off of the long term trend line. However, it is struggling to get past $17.50 resistance. If $15.50 breaks, the stock can retreat to $12.66 area.
For now sitting on the side line and waiting to see if the trend line can provide support again in the near future.
However, if the price breaks down to $13 or below, I would be a buyer.
———————————————————
How to read my charts?
- Matching color trend lines shows the pattern. Sometimes a chart can have multiple patterns. Each pattern will have matching color trend lines.
- The yellow horizontal lines show support and resistance areas.
- Fib lines also show support and resistance areas.
- The dotted white lines show the price projection for breakout or breakdown target.
Disclaimer: Not investment advice.

FMID-TERM: Scuffed bullish gartley (could also be looked at as a cypher with a shallow B point), higher low double bottom, break above 200 MA, wedge breakout, weekly trendline bounce, weekly hidden bullish divergence. (not financial advice)

Ford Motor Heading To $20Between Feb. 18 and Monday, Ford looks to have settled into a bullish inverted head-and-shoulder pattern, with the left shoulder formed between Feb. 18 and March 2, the head created between March 3 and March 22 and the right shoulder created between March 23 and Monday. On Tuesday, Ford gapped up about 2% higher, which caused the stock to break up over the descending neckline of the head-and-shoulders pattern. The measured move of the inverted head-and-shoulders pattern, which is calculated by adding the distance between the bottom of the head and the neckline to the middle of the neckline, is about 13%. This indicates Ford could trade up toward the $20 level. Following the gap-up open, big bullish volume came in and caused the stock to soar up over 3% within the first few minutes of the market's opening. The big bullish volume confirms the head-and-shoulder pattern was recognized.
Ford has a gap above on the chart between $18.59 and $19.87. Gaps on charts fill about 90% of the time, which makes it likely Ford will trade up to fill the empty range in the future.
Ford is also trading in a confirmed uptrend, with the most recent higher low printed on Monday at $16.28 and the most recent higher high created on Tuesday. Traders who aren’t already in a position could watch for the next higher low to take place, which could coincide with a backtest of the neckline of the inverted head-and-shoulders pattern.
Ford is trading above the eight-day and 21-day exponential moving averages, but with the eight-day EMA trending below the 21-day. If Ford remains above the 21-day EMA for a period of time, the eight-day EMA will cross above the 21-day, which would give bulls more confidence going forward.
Bulls want to see sustained big bullish volume drive Ford up over a resistance level at $17.72, which would give the stock room to trade up into the lower half of the gap. Above the level, Ford has resistance at $18.99 and $20.51.
Bears want to see big bearish volume come in and drop Ford back down below the descending neckline, which could cause the stock to print a lower flow and negate the uptrend. Ford has support at $17.02 and $16.45.

F Possibly on its way out of teensLooking at the 4Hr i noticed F is at a key trend support and also at a key price action level. To pile it on top we have Bullish divergence as well? What you guys think?

Ford USA Sun Storm Investment Trading Desk & NexGen Wealth Management Service Present's: SSITD & NexGen Portfolio of the Week Series
Focus: Worldwide
By Sun Storm Investment Research & NexGen Wealth Management Service
A Profit & Solutions Strategy & Research
Trading | Investment | Stocks | ETF | Mutual Funds | Crypto | Bonds | Options | Dividend | Futures |
USA | Canada | UK | Germany | France | Italy | Rest of Europe | Mexico | India
Disclaimer: Sun Storm Investment and NexGen are not registered financial advisors, so please do your own research before trading & investing anything. This is information is for only research purposes not for actual trading & investing decision.
#debadipb #profitsolutions


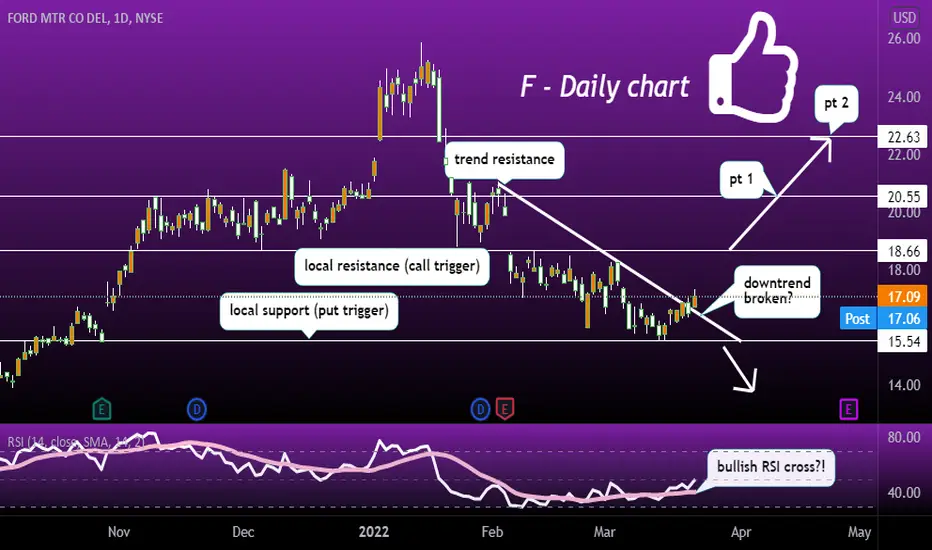
needs some more time, but could rally soon...F breaking a local trend resistance and showing bullish RSI cross, but id still like to see a move over local resistance before taking a long position.
watching for longs above 18.66, and may go short below 15.54
Ford Green This MorningWow did ford pop this morning or what. Calls absolutely printed, Puts absolutely dumped. Lets keep an eye on Ford and see where it goes for the rest of the day.


Ford back to $20 ?Can ford make its way back to $20. I think it can if bulls push it. Technically i see some downward movement before we take off. What do you think?

Khans Intraday-Ideas 03/21/22 - 02 - FSold my Calls towards market close on Friday to secure 45-70% Profit
For now it looks like we could have a small pullback at open - will reconsider to rejoin the trade

FORD FURTHER TO FALLRetrace on Ford not done
50% retrace a target
But i think it will complete the structure
GRI 2022
