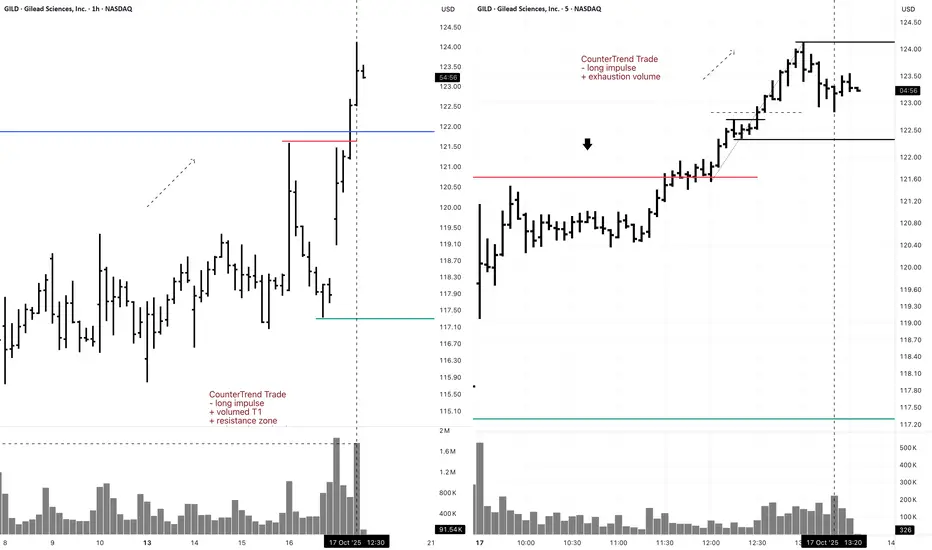
GILD 5M Short CounterTrend Daytrade (Buy Put to Open)5M CounterTrend Trade
- long impulse
+ exhaustion volume
1H CounterTrend
"- long impulse
+ volumed T1
+ resistance zone
+ volumed reaction bar"
1D CounterTrend
"- long impulse
- unvolumed T1
+ resistance level
+ volumed manipulation bar "
1M CounterTrend
"- long impulse
+ volumed T1 level
+ resistance zone"
1Y CounterTrend
"- long impulse
- unvolumed T1
+ resistance zone"
Trade ideas
GILD - Leading to the top =======
Volume
=======
- increasing
==========
Price Action
==========
- rounding bottom recently
=================
Technical Indicators
=================
- Ichimoku
>>> price above cloud
>>> Green kumo budding
>>> Tenken + Chiku - above clouds and pointing up
>>> Kijun - Above clouds and pointing up
=========
Oscillators
=========
- MACD bullish
- DMI bullish
- StochRSI, bullish, near regions of overbought
=========
Conclusion
=========
- short to long term breakout swing
- price may reverse at current level, to enter spot or wait for pullback at entry 2.
=========
Positions
=========
Entry - $122
Entry 2 - $118
Stop - $110
Exit 1 - $128
Exit 2 - $133
Exit 3 - $138
Exit 4 - $143
Exit 5 - $150

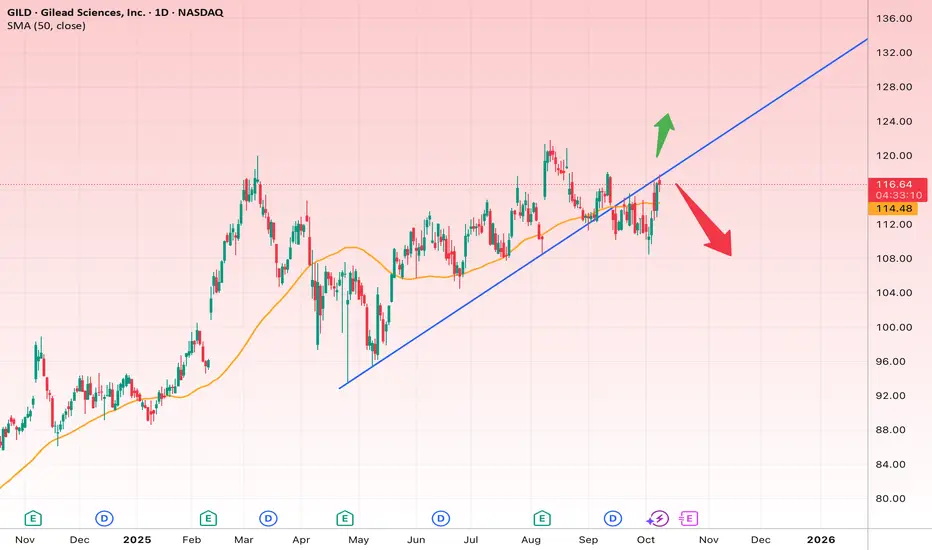
Gilead’s Critical Battle at the Uptrend Line!
Analysis:
The daily chart of Gilead Sciences (GILD) shows that the stock, after a short-term correction, is once again approaching its main uptrend line (blue). The 50-day moving average (orange) around $114.50 acts as a key support level, and the current price is trading slightly above it.
At this stage, the stock sits at a decisive point — it could either reclaim its bullish momentum by breaking above resistance or enter a deeper corrective phase if support fails.
Short-term outlook (2–4 weeks):
If the price manages to hold above $118, the next upside targets are in the $119.80–$124.80 range. This area represents the short-term bullish objective.
A reasonable stop loss for this scenario is just below $114.
Long-term outlook (2–3 months):
If the stock breaks decisively above $125 and maintains that momentum, the next major targets would be in the $130–$134 range, which also aligns with the previous highs.
However, if the blue uptrend line breaks down and a daily candle closes below $113, a bearish move toward the $106–$108 range becomes likely. In that bearish scenario, the stop loss should be placed above $113.
Overall, GILD is at a decision point. As long as it trades above $114, the bullish outlook remains valid — but losing that support could shift the balance in favor of the bears.
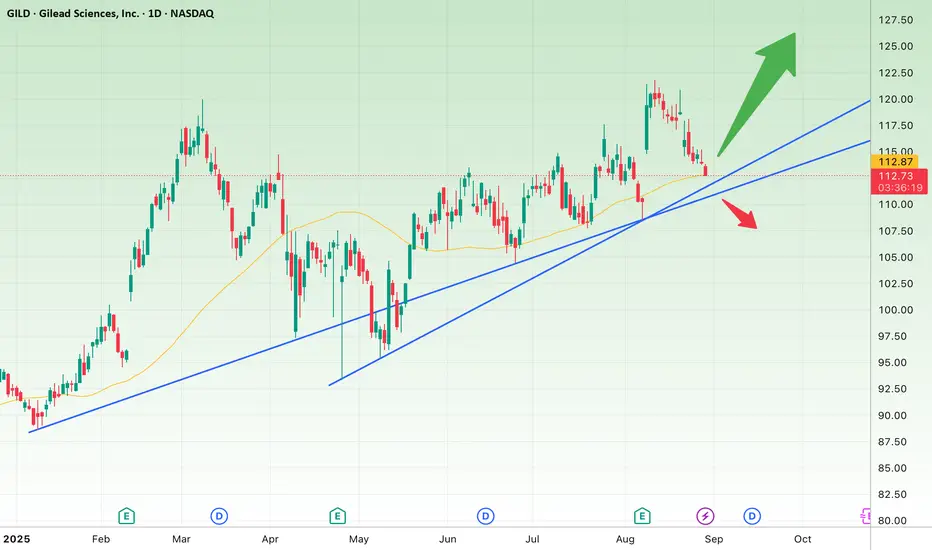
GILD at a Key Decision Zone!📊 Technical Analysis of GILD (NASDAQ)
After a strong rally since the beginning of the year, the price is now testing a major ascending trendline support around $112 – $110.
✅ If the support holds and the price rebounds, we could see continuation towards the next resistance levels at $118 and $125.
❌ However, a breakdown below $110 with confirmation may trigger a deeper correction, opening the way towards $105 and potentially $98.
🔹 The reaction to this critical support zone will determine the next major move for GILD.
GILD Ichimoku Breakout – Targeting 13% UpsideGilead Sciences (GILD) has broken above cloud resistance and the conversion line on the daily Ichimoku chart, setting up a clean breakout trade.
Entry: $108.88
Target: $123.81 (+13.71%)
Stop: $104.15 (-4.34%)
Risk/Reward Ratio: 3.16
Volume & Momentum: Confirmed by CM_Ult_MacD and Williams %R near overbought (-19.91)
Price has cleared the cloud with bullish structure and higher lows. Strong follow-through could push GILD toward the R1 pivot near $124.80.

GILD eyes on $111: Major Resistance zone that could mark a TopGILD has been faring better than other pharma companies.
It has just hit a major resistance zone at $110.74-111.74
Look for a Dip-to-Fib or a Break-n-Retest for long entries.
Previous Analysis that nailed all the key levels:
===================================================
.

GILD eyes on $106.82: Key resistance before Trump pharma tariffsPharma next up in Trump's cross-hairs.
GILD is waiting at a moderate resistance.
News could dump it or break and rocket.

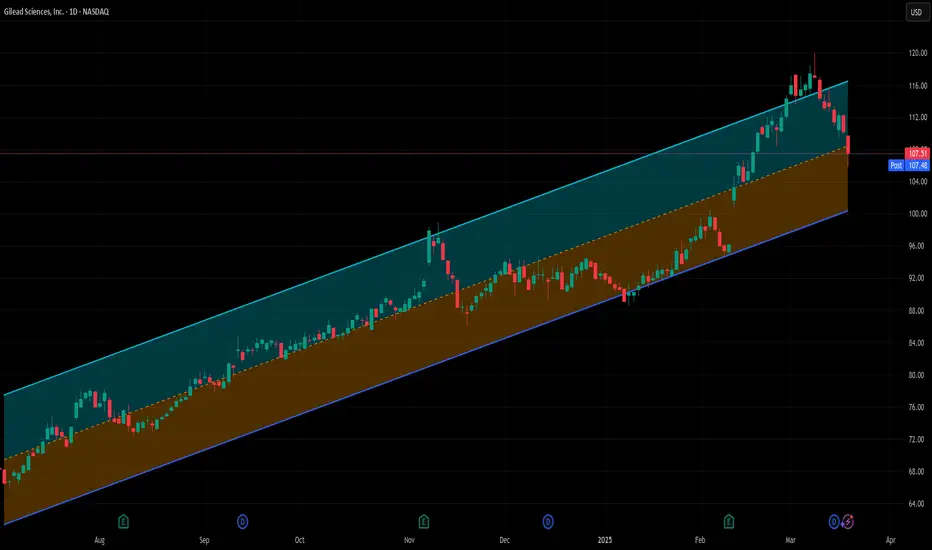
GILD is a dangerous buy, but a buy nonetheless for me.There is a lot NOT to like about this trade. Yes, I see how far it has run. Yes, I see how fast it is falling. Yes, I see the gap from 96 to 102 that “must” be filled. Yes, the market overall has been unhelpful of late. I realize all of it and I wouldn’t necessarily recommend anyone follow me on this trade because of all of that.
Here’s my “bull” case, such that it is with the way I trade. It's solidly in a long term uptrend. I know I’m jinxing myself with this, but GILD hasn’t had a trade with my system last longer than 5 days in almost a year. I did one last Friday that took 1 day to pay off, so going back so soon is REALLY tempting fate. But I am a slave to the data. The long term W/L record at this point is 988-0 for GILD.
The average gain for those trades is +2.55% in an average of 13 trading days. The vast majority have closed in 2 days or less. Those numbers are a compelling argument for me.
It is very possible, given the recent market action and its own price action, that this will be a longer than average trade in GILD. But it could also be like last Friday’s trade, too - one and done. There isn’t much else that is appealing to my algo right now - yesterday there was literally only one large cap stock that was a buy and it wasn’t in the top half of my rankings, so I didn’t trade it. Today this is one of fewer than 10, and the others are all lower tier stocks for me, historically.
So here’s hoping I catch lightning in a bottle twice in one week with this stock. Entered my initial position at the close for 107.51. Per my usual strategy, I'll add to my position at the close on any day it still rates as a “buy” and I will use FPC (first profitable close) to exit any lot on the day it closes at any profit.
As always - this is intended as "edutainment" and my perspective on what I am or would be doing, not a recommendation for you to buy or sell. Act accordingly and invest at your own risk. DYOR and only make investments that make good financial sense for you in your current situation.
GILD - looks ready for a pull back. Some nice targets on GILD let's see how many we can get to. What do you think? Will break through stops and continue higher or flush? GL!

Gilead Sciences (GILD) Soars 4.93% on Strong Q4 Earnings ReportsGilead Sciences (NASDAQ: NASDAQ:GILD ) is making waves in the biotech sector after delivering a stellar fourth-quarter earnings report that not only crushed Wall Street expectations but also set the stage for a promising 2025. The stock surged 4.50% in premarket trading on Wednesday, signaling strong investor confidence in the company’s growth trajectory.
Quarter and Optimistic Guidance
Gilead’s Q4 earnings report was nothing short of impressive. The company posted adjusted earnings of $1.90 per share, a 10.5% year-over-year increase, and handily beat analysts’ estimates of $1.74. Revenue climbed 6% to $7.57 billion, surpassing the consensus forecast of $7.15 billion.
HIV Franchise Shines Bright
Gilead’s HIV portfolio remains its crown jewel. Biktarvy, the company’s flagship HIV treatment, generated $3.8 billion in sales, up 21% year-over-year and well ahead of the $3.47 billion forecast. Descovy, another HIV drug, also outperformed expectations, with sales rising 21% to $616 million. Combined, Gilead’s HIV product sales reached $5.45 billion, up 16% from the previous year.
Looking ahead, Gilead is poised to expand its HIV franchise further with the anticipated mid-2025 launch of lenacapavir, a twice-yearly injectable for HIV prevention. The U.S. Food and Drug Administration (FDA) is expected to make a decision on the drug by mid-2024, and its approval could be a significant growth catalyst.
Oncology and Liver Disease: Steady Growth
Gilead’s oncology and liver disease segments also contributed to the strong quarter. Sales of its cell therapies for cancer treatment rose 5% to $488 million, beating expectations of $476 million. Trodelvy, a cancer drug, saw sales jump 19% to $355 million, surpassing the $324 million forecast. Liver disease treatments brought in $719 million, up 4% year-over-year.
Veklury: The Only Blemish
The only downside in Gilead’s report was Veklury, its COVID-19 treatment. Sales plummeted 53% to $337 million due to lower hospitalizations, particularly in the U.S.
Upbeat 2025 Guidance
Gilead’s bullish outlook for 2025 further fueled investor optimism. The company expects adjusted earnings of $7.70 to $8.10 per share on product sales of $28.2 billion to $28.6 billion. The midpoint of this guidance exceeds analysts’ estimates of $7.61 per share and $28.35 billion in revenue.
Technical Analysis
From a technical perspective, Gilead’s stock is showing strong bullish signals. As of Wednesday’s premarket trading, GILD is up 4.93%, poised to form a gap-up pattern upon market open.
Key Levels to Watch
- Resistance: A breakout above the 1-month high of $100 could serve as a critical catalyst for a sustained bullish run. This level represents a psychological barrier, and a decisive move above it could attract more buyers.
- Support: In the event of a pullback, immediate support lies at the 65% Fibonacci retracement level, which aligns with the $92 mark. This level could act as a springboard for renewed upward momentum.
RSI Indicates Room for Growth
The Relative Strength Index (RSI) stands at 55, indicating that the stock is neither overbought nor oversold. This suggests there is ample room for further upside, especially if the broader market sentiment remains favorable.
Conclusion
Gilead Sciences (GILD) is firing on all cylinders, with a strong Q4 earnings beat, robust guidance for 2025, and a promising pipeline. The company’s leadership in the HIV market, coupled with its growing presence in oncology and liver disease, positions it well for long-term growth. From a technical standpoint, the stock is primed for a breakout, with key resistance and support levels offering clear markers for traders and investors.

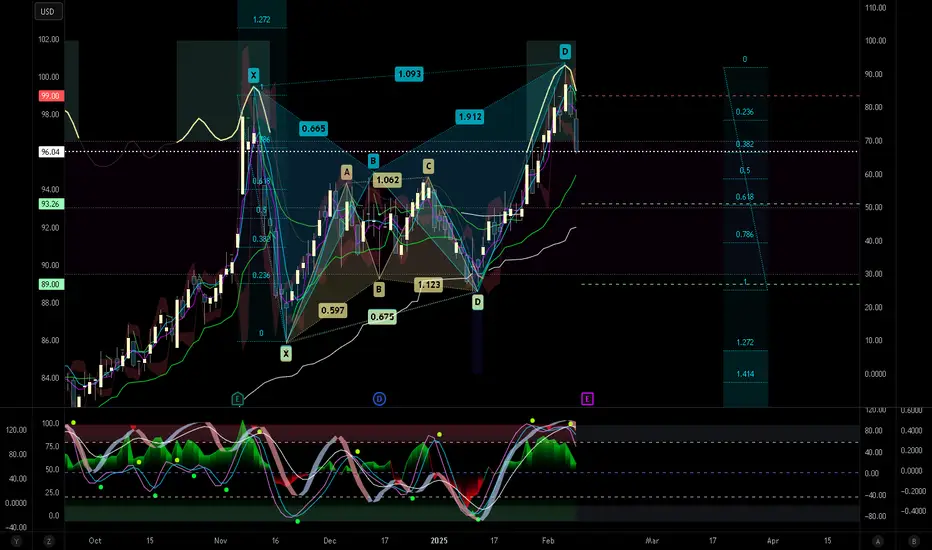
Harmonic Within a Harmonic on Gilead. GILDThey are crooked looking, but are present. Another tangent of evidence on the obvious fractal nature of markets. That thick candle to us confirms break of trend and the underlying indicators are also suggestive. It is prudent to note that the indicator readings have been formed by price action, volume and volatility immediately coming prior to that candle. Good luck out there!
$GILD Gilead Sciences Inc - Fib GP On Alert NASDAQ:GILD Gilead Sciences Inc -
-The ATH Fib Golden Pocket on alert for next week.
-Potential earnings Run-up
-Rotation

GILD Gilead Sciences Options Ahead of EarningsAnalyzing the options chain and the chart patterns of GILD Gilead Sciences prior to the earnings report this week,
I would consider purchasing the 89usd strike price Calls with
an expiration date of 2024-11-15,
for a premium of approximately $2.91.
If these options prove to be profitable prior to the earnings release, I would sell at least half of them.

Gilead Pullback!Three bear bars is a concern but, with 2 different measured moves objects above and a solid trend upwards, I think its worth a shot for a long. If it is worth anything, the whole industry seems to be trending positively.


Gilead Sciences (GILD): Will Support Hold or Will We See a Drop?We've neglected Gilead Sciences for a while, but it's time for an update. Unfortunately, our entry looking back wasn't ideal, as the stock has fallen below the 61.8% retracement level. It found support just below the 78.6% level, which marks the bottom of our range. This level was precisely touched, and we saw a relatively good movement upward from there.
However, the outlook remains uncertain. We hope that the stock does not fall below this range bottom, as it would prompt us to consider cutting it. Our first take-profit target is at the range high around $86.5, but reaching this level will take time as Gilead Sciences is currently underperforming.
Unlike most other stocks, Gilead Sciences operates in the research sector, not the tech sector. This means it follows a different cycle and is influenced by different capital flows. It tends to perform well when tech stocks do poorly. If tech stocks remain bullish, Gilead Science might continue to struggle. However, if there's a shift, Gilead Science could reverse and potentially reach up to $123, though this is quite far off.
We are holding our position for now, hoping not to cut if the stock falls out of the range. If it does, we will take necessary action.

Gilead Sciences (GILD): Pattern Still Intact—What’s the Plan?Let’s quickly review our open position in $GILD. We’ve managed to turn the whole chart around, and I hope everyone who bought in had the strength to sit it out. It was a close call with the stop loss, but now we’re up significantly, and we’ve moved our stop loss closer to $65.46. So far, we’re up 17%, and we don’t want to dictate when to take profits. If you’re in, do your own research and take profits whenever you feel comfortable—it's all up to you 👍.
If you take a closer look, you’ll see that NASDAQ:GILD has been following a nice upward pattern: a surge, then three candles down, then another surge. I’m not sure how long this pattern will hold, but as long as we don’t retrace too much, we should be fine. I also like that we’re respecting all the key levels. The RSI is about to be overbought, so we might see another three candles down, but this time it could be a deeper pullback.
We’ll see how it plays out, but we’re very pleased with this swing trade so far. Congratulations to everyone who’s been riding this wave 🍾.

Gilead Sciences (GILD): First Take Profit in a High RangeGilead Sciences is now back trading at the high end of its range, and we’ve decided to take our first profit here. It’s crucial to respect range-bound trading, and there is a strong possibility of a pullback at this point. However, we don’t expect this pullback to reach the lower end of the range again but rather settle in the middle. If NASDAQ:GILD reclaims this range high, it could provide even more upside and new opportunities.
We are also raising our stop loss to $65.80 to lock in gains. Gilead serves as our "natural hedge" against broader risk-on market conditions, and with a 40% bounce from the range low at the same time the S&P 500 is hitting new all-time highs, it’s clear that Gilead can benefit as well.
We’re keeping a close eye on this stock, and if another opportunity arises, we’ll be ready to act.

Swing Trade Potential Following Completed BottomNASDAQ:GILD has completed its bottom AND sustained the run up from the bottom completion, which provides strong support. The stock is now heading toward the previous resistance highs from January; this is not strong resistance. The type of sideways trend developing now builds energy that can easily move above that weaker resistance. Swing trade watch. Earnings are in a month.

GILD potential Buy setupReasons for bullish bias:
- Price gave LH breakout
- Strong bullish divergence
- Price bounce from support zone
Here are the recommended trading levels:
Entry Level(CMP): 68.30
Stop Loss Level: 60.81
Take Profit Level 1: 76.05
Take Profit Level 2: 83.67
Take Profit Level 3: Open


GILD is BullishPrice was in a strong downtrend, however the bulls woke up and won control of the price action, following bullish RSI divergence on daily time frame, now first higher high and higher low are defined, and if previous higher high is broken, we can expect a bullish rally according to Dow theory. Targets are mentioned on the chart.

Bullish reversal is a clear confirmationNASDAQ:GILD had a strong bullish buying pressure at the bottom with the support of a volume spike. Furthermore, it has broken out of the downtrend line. Double bottom formation is confirmed and Mid-term stochastic is showing confirmation of oversold together with divergence.
Hence, we will buy on market spot upon open or a retracement to 69.11 or 64.85.
