General Motors: Turning Headwinds into GrowthWhen the global auto industry was rattled by tariffs, regulatory uncertainty, and the volatile EV market, many would have expected General Motors NYSE:GM to struggle. Instead, the Detroit giant did something remarkable: it turned challenges into opportunities.
In a single day after reporting earn
Key facts today
1,000 ARS
5.50 T ARS
171.64 T ARS
About General Motors Company
Sector
Industry
CEO
Mary Teresa Barra
Website
Headquarters
Detroit
Founded
1908
ISIN
ARBCOM460408
FIGI
BBG018186K10
General Motors Co. engages in the designing, manufacturing, and selling of trucks, crossovers, cars, and automobile parts, and in providing software-enabled services and subscriptions. It operates through the following segments: GMNA, GMI, Cruise, and GM Financial. The company was founded by William C. Durant on September 16, 1908 and is headquartered in Detroit, MI.
Related stocks

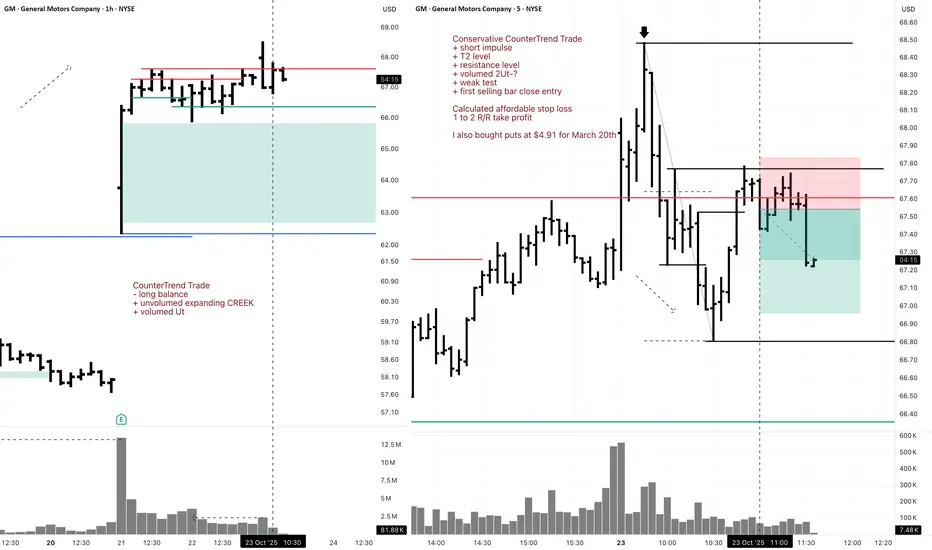
GM Short 5M DayTrade Conservative CounterTrend TradeConservative CounterTrend Trade
+ short impulse
+ T2 level
+ resistance level
+ volumed 2Ut-?
+ weak test
+ first selling bar close entry
Calculated affordable stop loss
1 to 2 R/R take profit
I also bought puts at $4.91 for March 20th
1H CounterTrade
"- long balance
+ unvolumed expanding CREEK
+
General Motors (GM) Shares Hit All-Time HighGeneral Motors (GM) Shares Hit All-Time High
As shown on the General Motors (GM) stock chart:
→ During yesterday’s intraday session, the share price climbed above $67.40, surpassing the previous record high set in January 2022.
→ GM was among the top performers on the stock market, rising by aroun

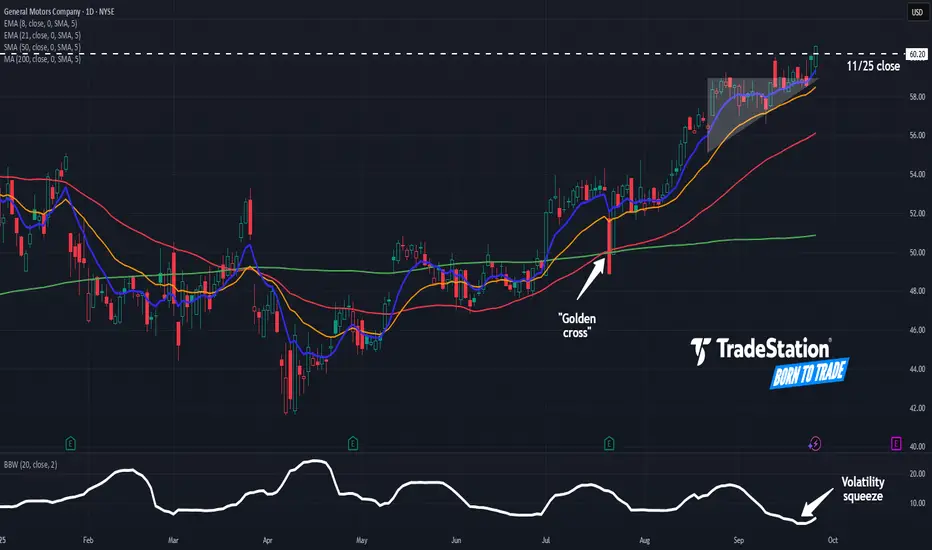
General Motors Could Be AcceleratingGeneral Motors has pushed higher amid low volatility, and some traders may think the automaker is starting to accelerate.
The first pattern on today’s chart is the series of higher lows since mid-August. Prices mostly remained below $59 until last week, creating an ascending triangle. They now seem
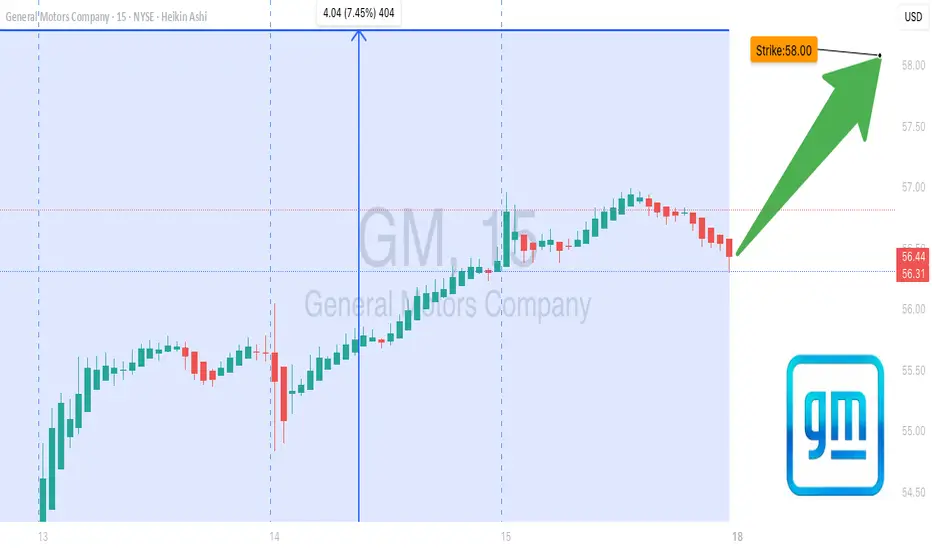
GM Breakout Watch – Calls Ready to Pop🚀 GM Swing Trade – \$58 Calls in Play!**
**Moderate Bullish Bias | Aug 15, 2025**
**📊 Key Highlights:**
* **RSI:** 74.2 – Strong bullish momentum 🔥
* **Price Momentum:** 5D +6.0%, 10D +8.0% 📈
* **Volume:** Weak ⚠️ (1.0x avg vs 1.3x needed)
* **Options Flow:** Neutral – No strong institutional lea
General Motors: Strong EV Strategy and Earnings Momentum Signal Current Price: $53.22
Direction: LONG
Targets:
- T1 = $54.45
- T2 = $55.54
Stop Levels:
- S1 = $52.34
- S2 = $51.10
**Wisdom of Professional Traders:**
This analysis synthesizes insights from thousands of professional traders and market experts, leveraging collective intelligence to identify

Like this set up on GM using the 3 touch point TL StrategyLike this set up on GM using the 3 touch point trendline strategy

General Motors (NYSE: $GM) Reports 17% Y0Y in Q12025 Sales General Motors (NYSE: NYSE:GM ) opened at $44.46 on April 4th, 2025, down 3.91%. The stock declined $1.80 in early trading. This came a day after Trump’s new 25% auto import tariffs took effect. In a report released on April 2nd, GM delivered 693,363 vehicles in Q1 2025, a 17% year-over-year increa

GM Stock Chart Fibonacci Analysis 032125Trading Idea
1) Find a FIBO slingshot
2) Check FIBO 61.80% level
3) Entry Point > 48/61.80%
Chart time frame: C
A) 15 min(1W-3M)
B) 1 hr(3M-6M)
C) 4 hr(6M-1year)
D) 1 day(1-3years)
Stock progress: A
A) Keep rising over 61.80% resistance
B) 61.80% resistance
C) 61.80% support
D) Hit the bottom
E

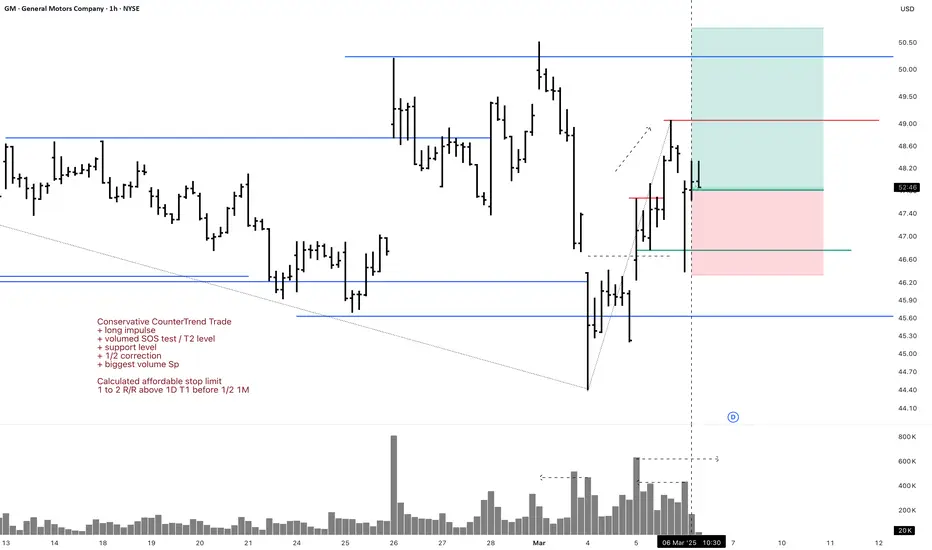
GM 1H Long Swing Conservative CounterTrend TradeConservative CounterTrend Trade
+ long impulse
+ volumed SOS test / T2 level
+ support level
+ 1/2 correction
+ biggest volume Sp
Calculated affordable stop limit
1 to 2 R/R above 1D T1 before 1/2 1M
Daily CounterTrend
"- short balance
- unvolumed expanding T1
+ volumed 2Sp+
+ test"
Monthly Trend
See all ideas
Summarizing what the indicators are suggesting.
Oscillators
Neutral
SellBuy
Strong sellStrong buy
Strong sellSellNeutralBuyStrong buy
Oscillators
Neutral
SellBuy
Strong sellStrong buy
Strong sellSellNeutralBuyStrong buy
Summary
Neutral
SellBuy
Strong sellStrong buy
Strong sellSellNeutralBuyStrong buy
Summary
Neutral
SellBuy
Strong sellStrong buy
Strong sellSellNeutralBuyStrong buy
Summary
Neutral
SellBuy
Strong sellStrong buy
Strong sellSellNeutralBuyStrong buy
Moving Averages
Neutral
SellBuy
Strong sellStrong buy
Strong sellSellNeutralBuyStrong buy
Moving Averages
Neutral
SellBuy
Strong sellStrong buy
Strong sellSellNeutralBuyStrong buy
Displays a symbol's price movements over previous years to identify recurring trends.
G
GM5502199
General Motors Financial Company, Inc. 6.75% 20-NOV-2028Yield to maturity
6.42%
Maturity date
Nov 20, 2028
G
GM5565379
General Motors Financial Company, Inc. 5.85% 20-APR-2029Yield to maturity
6.27%
Maturity date
Apr 20, 2029
G
GM5509429
General Motors Financial Company, Inc. 5.75% 20-DEC-2026Yield to maturity
6.07%
Maturity date
Dec 20, 2026
G
GM6006873
General Motors Financial Company, Inc. 5.7% 20-FEB-2033Yield to maturity
5.60%
Maturity date
Feb 20, 2033
G
GM6013226
General Motors Financial Company, Inc. 5.6% 20-FEB-2033Yield to maturity
5.58%
Maturity date
Feb 20, 2033
See all GM bonds
Curated watchlists where GM is featured.


