A POSITIVE MOVING AVERAGE CROSS FOR GMOn March 24, 2017 the General Motors Company (GM), crossed above its 150 day moving average. Historically this has occurred 20 times since 2010. When this happens, the stock gains a minimum of 0.475%, has a median gain of 5.466% and maximum gain of 16.159% over the next 24 trading days. On March 23, 2017, the stock broke below the 150 moving average and broke above the moving average on the following day. This has occurred three times since August 2016 and the stock gained 6.686%, 5.674% and 16.159%.
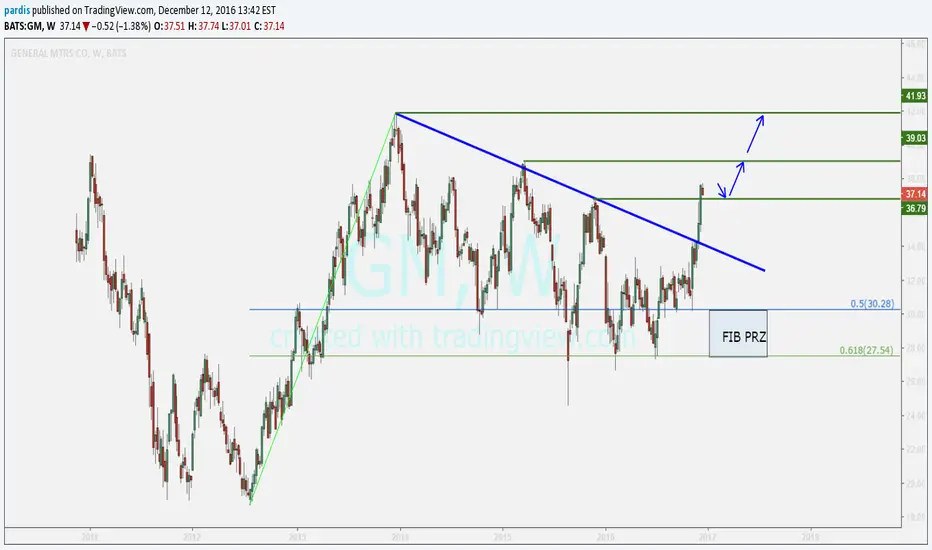
Current General Motors chart from TradingView
When we take a look at other technical indicators, the relative strength index (RSI) is at 32.6033. RSI tends to determine overbought and oversold levels. I personally use anything above 75 as overbought and anything under 25 as oversold. The current reading declares the stock just flirted with the oversold mark and may begin to move upward.
The true strength index (TSI) is currently -5.3793. The TSI determines overbought/oversold levels and/or current trend. I solely use this as an indicator of trend as overbought and oversold levels vary. The TSI is double smoothed in its calculation and is a great indicator of upward and downward movement. The current reading declares the stock is trending downward which could be skewed due to the market drop on March 21. Even though it is pointing downward four of the last five times it was near this level, the stock reversed upward.
The negative vortex indicator (VI) is currently 1.3790. The VI determines current trend and direction. When the positive level is higher than 1 and higher than the negative indicator, the overall price action is moving upward. When the negative level is higher than 1 and higher than the positive indicator, the overall price action is moving downward. The current reading declares the stock is trending downward, but it is near the reverse point where the stock normally goes up big.
Considering the moving average crossover, RSI, TSI, and VI levels, the overall near-term stock direction appears to be trending upward. Based on historical movement compared to current levels, the stock could gain at least another 7.86% over the next four weeks.
DISCLOSURE: I currently do not have positions in the stock mentioned above. I most likely will not enter a position within the next 72 hours. Historical movements and technical indicators should never be the sole basis for entering positions involving risk. Make sure appropriate research is conducted prior to taking any risk in a marketplace.
Trade ideas


option playYou can get next Friday $34 puts for .03. That channel looks very inviting for 3 cents of risk.

GM short entry at top of price channel$GM is currently trading at the top of its price channel and is forming a shooting star pattern on its daily chart. Furthermore, it's also forming a sort of "micro" head and shoulders pattern with the two previous channel highs.
Looking at the hourly shows decreased volume, declining MACD, and declining RSI from yesterday. Combined this presents a very strong bearish divergence which we can take advantage of.
Strategy:
-
Enter trade SHORT by COB today or on break of the hourly convergence pattern support line, whichever happens first.
Set price target at $35, but be aware that there will be resistance at the 37.25, 36.60, and 35.53 levels, which all may provide valid exit points. Again, see the hourly charts to clearly see the resistance points at these prices.
set stop loss at top of shooting star or a similarly sensible position.


GM good newsGM is trading abv 37.00 on pre-market on news it might sell Vauxhall and Opel brands to Peugeot.
Seems like if it manages to stay abv 36.50-75 zone there might be a good long w/target into 38.00

General Motors: Bullish Bat Suggests Upside BreakoutMost of the indicators I follow suggest that GM-is about to surge higher.
The top lower indicator (AO) has issued an upside reversal signal, as well as the top middle indicator.
Shorter time horizon charts (one hour, two hour) are more bullish than this four hour chart.
On a daily chart, the full stochastic indicator (14,3,3) bottomed on February 9th (in fact, a double bottom).
If you follow sigma bands, GM-is minus three sigma.
In simple terms, this means it's probable will GM-will trade higher 99.73% of the time from this extreme lower sigma level.
The next resistance point is approximately $38.50.
Disclaimer: I have been long this stock since yesterday.
May all of your trades go well.
And, to the world - happy Valentine's Day.
Don.


GM looking to go higherLong monthly trendline decisively broken. Path of least resistance appears to be up. I am looking for a surge in volume to give authority to this possible breakout.

GM: Daily viewGM is an excellent company to own for the long term. That being said, outside of a core long term position in it (something like 10% is perfectly fine), we can also trade and profit from volatility, both on the long side (adding trades with trailing stops, and adding to winners) and on the short side (selling calls against our long term longs to profit from corrections).
In this case, after today's news, we see that the daily has flashed a 'Time at mode' uptrend signal with a target at 39.57 that has to be hit before January 31st. Since this uptrend's time duration expires just before earnings, it might be wise to reduce your exposure to GM approaching the target, and date, or to at least hedge your downside to protect profits by selling calls. In the case of earnings sending prices way higher, this would ruin the upside, so, the alternative is to start trailing stops periodically (at least on your non-core-long term positions) to reduce risk.
Good luck!
Ivan Labrie.

Sector Rotation: GM Descending Broadening WedgeIf ever you like to predict the further direction of an overall stockmarket than keep an eye on any sector rotation as well.
Since November we have seen Banks rising. If you follow this trading ideas you might see, that there is an ongoing rotation now into industrials. You see also huge consolidation patterns like in Tesla, GM or the German Automaker Volkswagen.
Again: To predict any direction in stockmarkets try to look for similar pattern in more stocks or diffent indices. If you follow this trading ideas than you see that in any case there is more than one issue discusssed.
This world in the year 2017 now is more connected with the www than ever and more linked in almost any direction than ever before. So look for similar patterns as much you can get to decide if you see a broad based move - or not. Even to the upside and later for the downside as well.


BUY GMIt is a bit late to enter the position, Risl/Reward ratio is Aabouhas not goot 1 for TP1, for TP2 it is very good.
SL: 23
TP1: 47
TP2: 63
Close half of the position if it reach to TP1 and break even the position


GM @ 1h @ will flag-formation confirm prices above 34.41 ?Take care
& analyzed it again
- it`s always your decission ...
(for a bigger picture zoom the chart)
Best regards
Aaron

long GM @ daily @ trading capability for this january`17This is only a trading capability - no recommendation !!!
While january`17 maybe i`ll confirm or change my opinion :)
Buying/Selling or even only watching is always your own responsibility ...
Best regards
Aaron

pullback on gm......buyin my idea it can be a pullback to broken tl...
uptrend...
buy after bullish candle

GM: If you missed our entry at KHL...jump in!GM is a great long term long, and good beta exposure for your portfolio. Earnings yield is terrific, the weekly setup presents a long term uptrend in place, and it's at a good location to enter longs now. Again, size it to fit your risk criteria, but like the rest, 2% is fine. You can buy it gradually over a couple days too.
Good luck,
Ivan Labrie.
