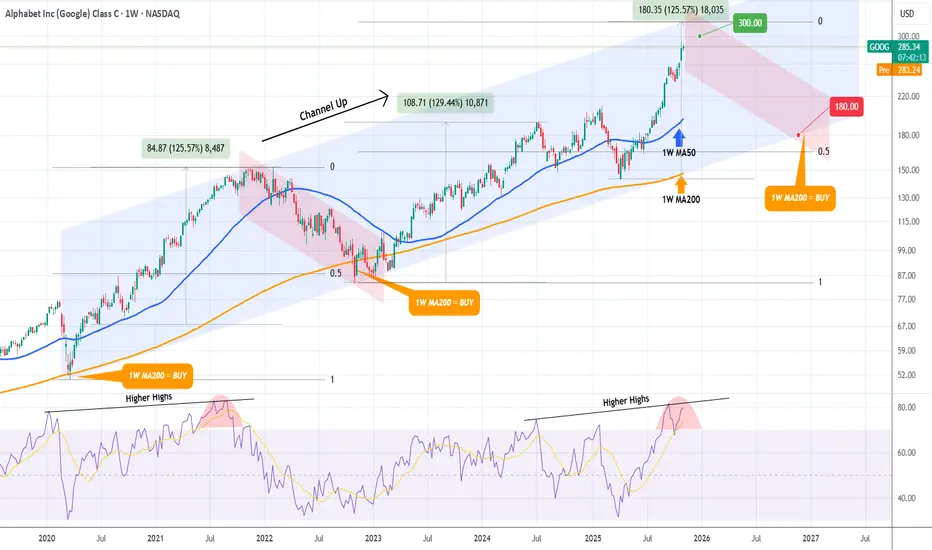
GOOGLE Bull Cycle running out of steam. Be ready to sell.It's been exactly 2 months (September 05, see chart below) when we last had a look at Google (GOOG) giving a strong break-out Buy Signal that methodically hit our $275 Target:
This time we look at the stock from a much longer term perspective on the 1W time-frame, where it is approaching the to
Key facts today
200 ARS
91.68 T ARS
320.31 T ARS
About Alphabet Inc (Google) Class C
Sector
Industry
CEO
Sundar Pichai
Website
Headquarters
Mountain View
Founded
2015
ISIN
ARDEUT116159
FIGI
BBG000QND871
Alphabet, Inc is a holding company, which engages in the business of acquisition and operation of different companies. It operates through the Google and Other Bets segments. The Google segment includes its main Internet products such as ads, Android, Chrome, hardware, Google Cloud, Google Maps, Google Play, Search, and YouTube. The Other Bets segment consists of businesses such as Access, Calico, CapitalG, GV, Verily, Waymo, and X. The company was founded by Lawrence E. Page and Sergey Mikhaylovich Brin on October 2, 2015 and is headquartered in Mountain View, CA.
Related stocks
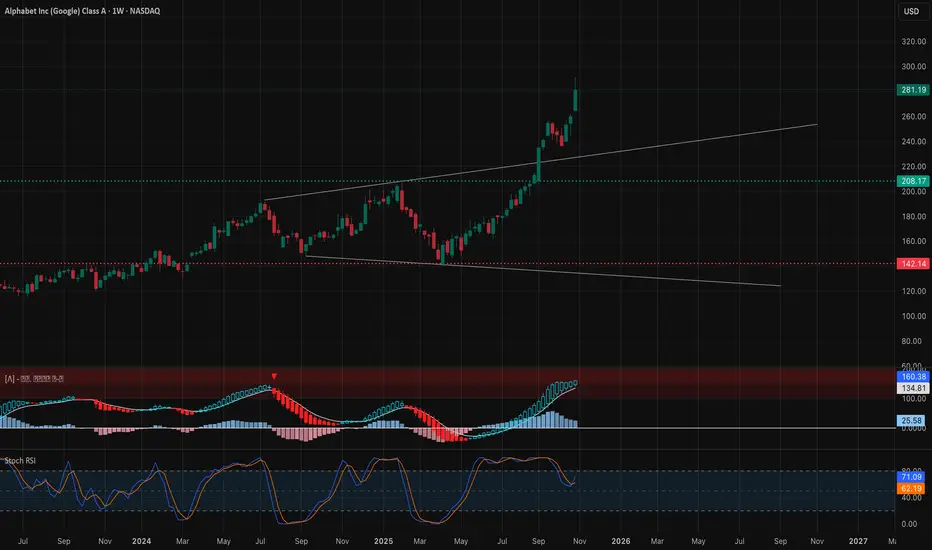
GOOGL Momentum Wave at Peak Extension- (Nov. 3–7)GOOGL Momentum Wave at Peak Extension – Liquidity Battle Ahead🔥
WEEKLY TIMEFRAME ANALYSIS
1. Market Structure
GOOGL remains in a dominant weekly uptrend with a clean BOS breakout over previous highs. The chart printed a shallow pullback that respected the mid-trendline before pushing higher — that’
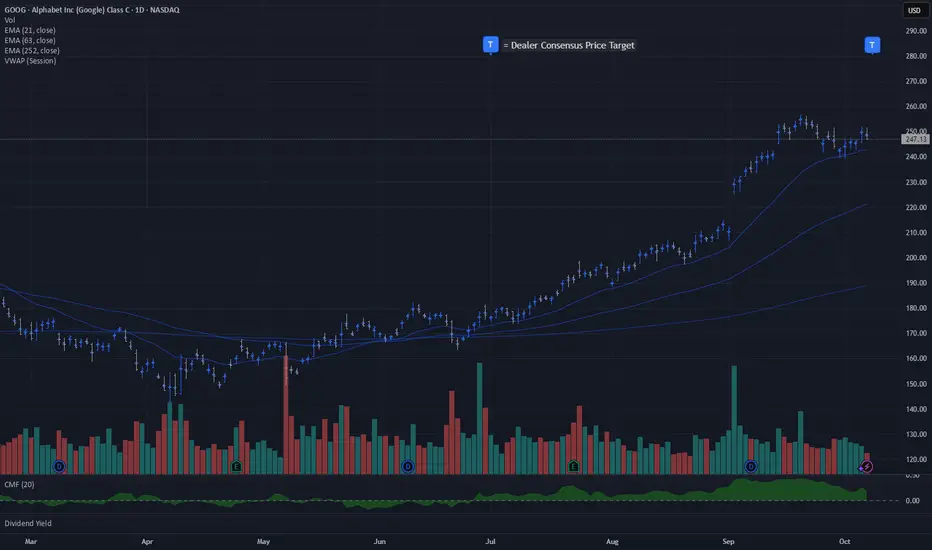
GOOG | Dealer Consensus Price Target $281Special appearance of a mega-cap on the top ranked dealer positioned names.
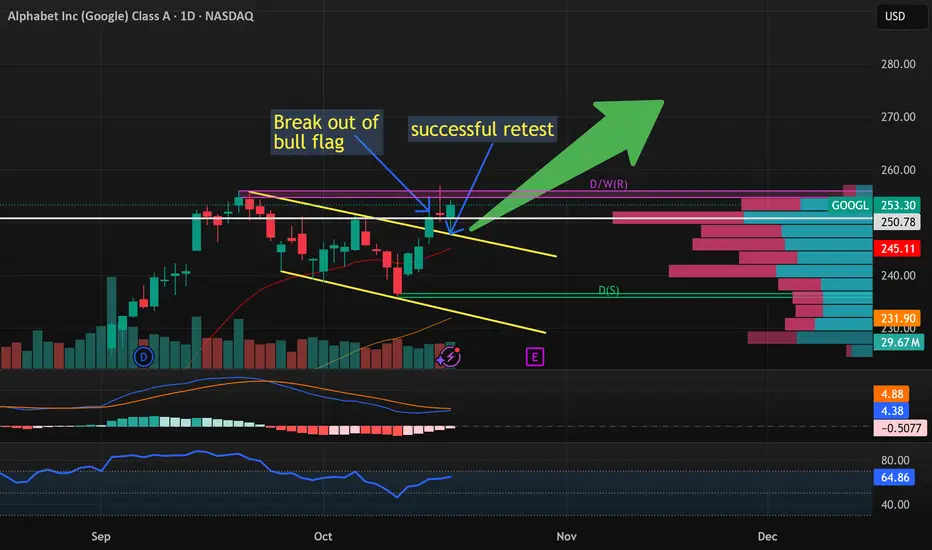
Bull run for GOOGL incoming?Google just pushed out of it's bearish flag channel. Then, on Friday it successfully retested it.
Trading at a forward of P/E of 19.6x which is the lowest of all the Mag7.
Ideally I'd like to see GOOGL break the ATH support and trade the breakout.
But that this point already, I will likely begin to
Breaking: Alphabet Inc. (NASDAQ: $GOOG) Spike 12% TodayThe share price of Alphabet Inc. (NASDAQ: NASDAQ:GOOG ) Spike 8% on Thursday early market trading breaking out of a bullish flag pattern.
The asset is currently overbought as seen by the RSI at 83, making it poised for a reversal in the short term. Adding to the bullish thesis, NASDAQ:GOOG is t

$GOOG | Alphabet Google | The Everything Tech CompanyAlphabet NASDAQ:GOOG is the everything tech company. Do your future self a favor and get some. Yes, it will crater as soon as you buy it. Your short-term future self will cry and whine and throw a fit and try to panic sell. But your far future self will appreciate it.
Robots? Had backflippin

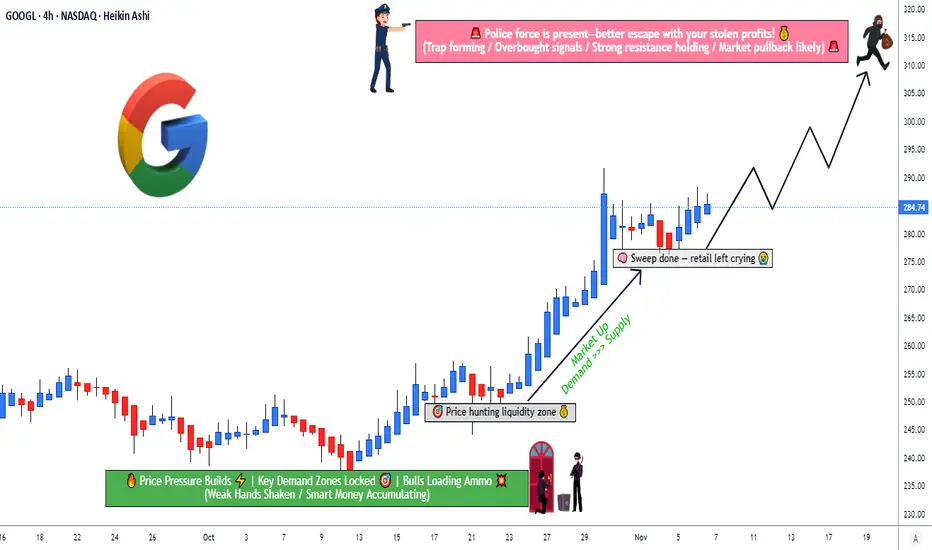
Can GOOGL Sustain Its Bullish Run Before 320 Resistance Hits?🎯 GOOGL HEIST: Operation Alphabet Escape Plan 💰
Alphabet Inc. (NASDAQ) - Swing Trade | Multi-Layer Entry Strategy
📊 THE SETUP
Sentiment: 🟢 BULLISH | Timeframe: Swing Trade | Risk Level: Medium
🎲 ENTRY STRATEGY: "THIEF LAYERING"
Strategic multi-level buy accumulation using limit orders
Layer-by-Lay
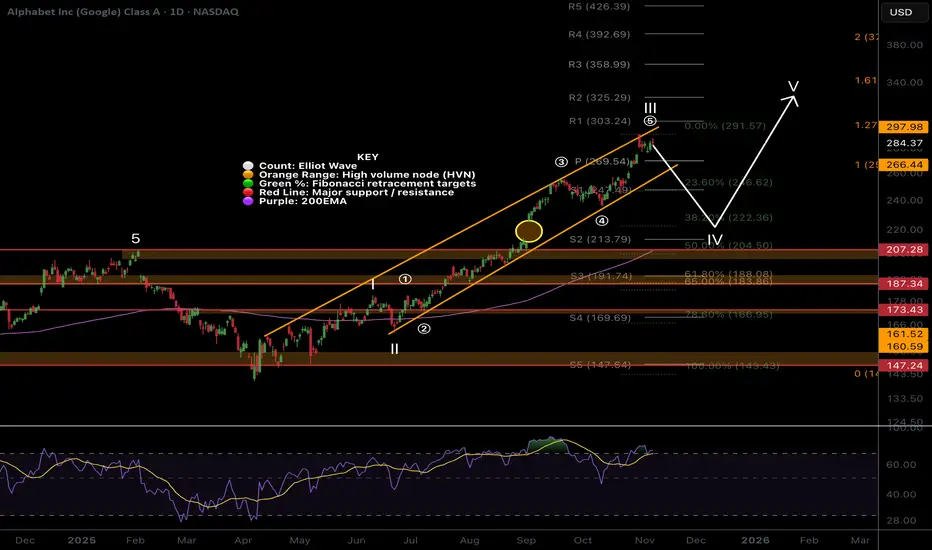
Google pullback still in play, local chartWave III continues but price looks exhausted and may trap late investors causing them to capitulate lower later.
Wave (5) of III is likely to complete with a throw-over of the upper channel boundary. Wave IV has an expected retracement target of the 0.382, $222, filling the gap left and meeting the
Participants in the Global Market: Understanding Who They Are ?1. Central Banks – The Guardians of Monetary Stability
Central banks are the most influential participants in the global market. Institutions like the U.S. Federal Reserve (Fed), European Central Bank (ECB), Bank of England (BoE), and Reserve Bank of India (RBI) control monetary policy in their res
All Priced In - Selling to CommenceFundamentals all baked in with price to sales ratio at previous 2021 post-covid highs will push to profit locking and selling pressure.
NASDAQ:GOOGL price target in the ~$230 range.
RSI weekly divergence and upper log line hit confluence with top fundamental ratios.

See all ideas
Summarizing what the indicators are suggesting.
Oscillators
Neutral
SellBuy
Strong sellStrong buy
Strong sellSellNeutralBuyStrong buy
Oscillators
Neutral
SellBuy
Strong sellStrong buy
Strong sellSellNeutralBuyStrong buy
Summary
Neutral
SellBuy
Strong sellStrong buy
Strong sellSellNeutralBuyStrong buy
Summary
Neutral
SellBuy
Strong sellStrong buy
Strong sellSellNeutralBuyStrong buy
Summary
Neutral
SellBuy
Strong sellStrong buy
Strong sellSellNeutralBuyStrong buy
Moving Averages
Neutral
SellBuy
Strong sellStrong buy
Strong sellSellNeutralBuyStrong buy
Moving Averages
Neutral
SellBuy
Strong sellStrong buy
Strong sellSellNeutralBuyStrong buy
Displays a symbol's price movements over previous years to identify recurring trends.
Curated watchlists where GOOGL is featured.


