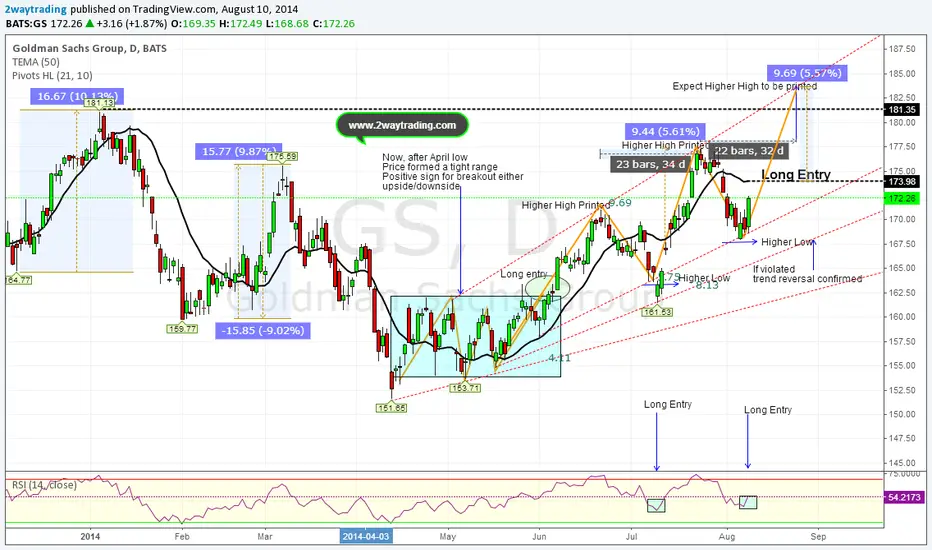
$GS Signals New Higher High From July's highDecember last year, the price gained that month 10% which was one of the few best months of the year, and tried to continued into this year, it failed and reversed that upside swing momentum and printed a new lower low from Dec low. It gained almost 10% from Jan low before it gave up all of it. It was not a good sign at all and price violated with strong volume 3-EMA and printed a new lower low from Dec, and Jan lows. April low supported with light volume suggested the bottom was in process and best trade was to take long above the consolidated square..or short below the lower. End of May price broke out upside and built a strong upside swing which printed higher highs and higher lows. Now, August price bounced from 61.8% from July low to July High which gives us some conviction that if price holds August low there is higher probability that we will see a new higher high or reclaim of December high. Stay safe and follow us if you like it.
Trade ideas
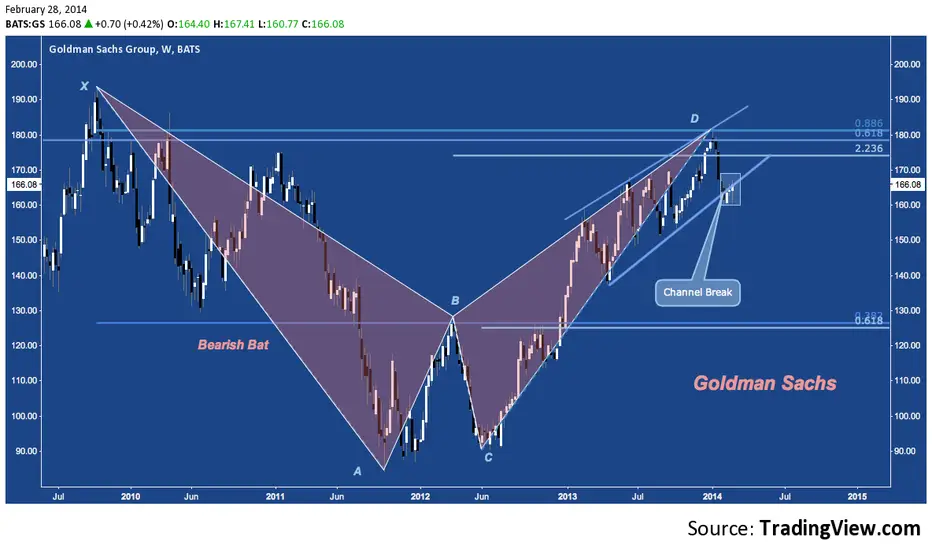
gscomparing the chart with the RSI indicator we find ourselves with two different synthetic indicator indicates 2 lower highs (February 2013 and the other maximum dicenbre 2013) while we are on the graph with increasing maximum 2 and the other factor that 'indicator shows a clear resistance to the maximum recorded in March 2014 this makes me think that the breaking strength of 170 is nothing but a false bullish signal and does not exclude the possibility that prices will return to support 160

$GS - daily chartGoldman Sachs just broke down through a few lines of support.
could fall further to ~$157 - especially if there's continued weakness in Europe.

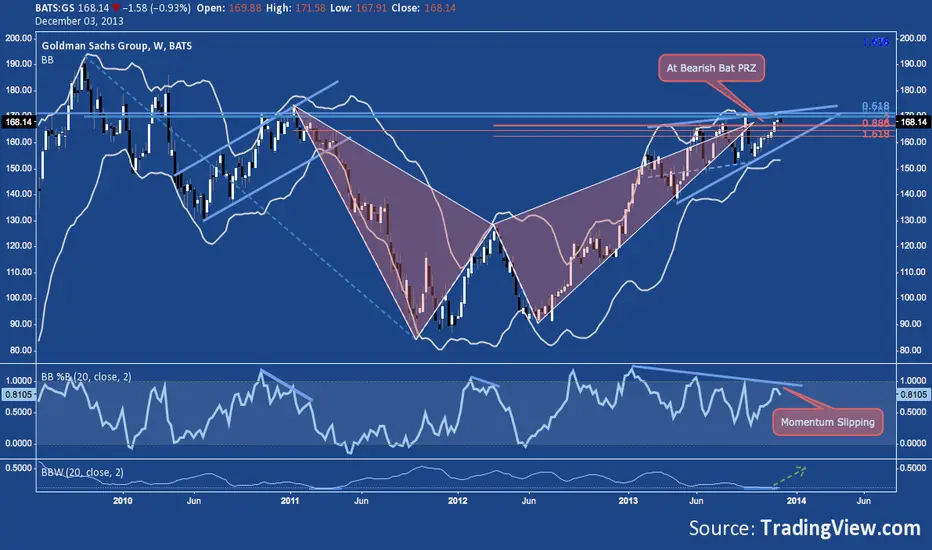
Goldman Sachs Is Talking To Us.For the past five years, stocks like Goldman Sachs Group Inc. (NYSE:GS) and JPMorgan Chase & Co. (NYSE:JPM) have led the rally in the stock market after being decimated during the Financial Crisis of 2008. After the "Too Big To Fail" banks were bailed out by the taxpayer, they have been able to borrow money from the Federal Reserve at 0%. They would use that money to buy US Treasuries and earn the interest - that's a nice free money policy, especially for the bankers who all basically went bust!
This easy money policy by the Federal Reserve has benefited firms like Goldman Sachs Group Inc. (NYSE:GS) since 2009, but the charts are warning us that the jig may be up for the "Too Big To Fail" banks. With the stock market at all time highs, Goldman Sachs Group Inc. (NYSE:GS) is 35% below its 2007 peak, and over 10% off its most recent high made in January of 2014.
With a Bearish weekly chart forming on Goldman Sachs and a proprietary time count coming into play, we will be looking to short this equity for a move lower in the coming weeks. When the time is right to enter GS for a high probability trade, we will alert all members of the Elite Round Table live. Come join myself and 3 other Pro Traders as we reveal exactly what is moving and when you should be buying and selling. This is a great time for the informed and educated trader and investor!
Evan Poechman
Elite Round Table, Pro Trader


Bonds soaring!..Probably signs of some serious instability.The rally in TLT is probably due to some instability in the system. Big banks have been weak all year. Look for a big washout this year , that takes them to areas of major support.

GS bear flag/triangleI like Short idea in Goldman Sachs (GS) here:
1) while the Dow and S&P have been trading nea rhighs I have seen a lot of divergences in the market. Weakness not only in tech but the banks also been an area of major concern. New regulation seems to have affected aspects of their business, and the future isn't looking as bright for the industry.
2) Bear flag. The stock borke down sharply in early April, and basically formed a bear flag/triangle type pattern. This pattern looks like it could resolve to downside for another move lower.
Yeasterday, it was trying to fil the gap area but closed off the lows, reasonable price for SHORT ENTRY here, next resistance zone from $160 to $162. I am looking for move to $152-$154 (TARGET) support area and potential break down if market will show us some weakness. I will ADD if it will go through lows.

GS better hold 151.A break of 151 and GS could go all the way to it's early 2013 levels. In early 2013, SPY was 140 !


GS Weekly Analysis 1/4/13Looking to challenge (and break) the next resistance at $179 (4/10 high) in a couple of weeks. Medium term bullish.


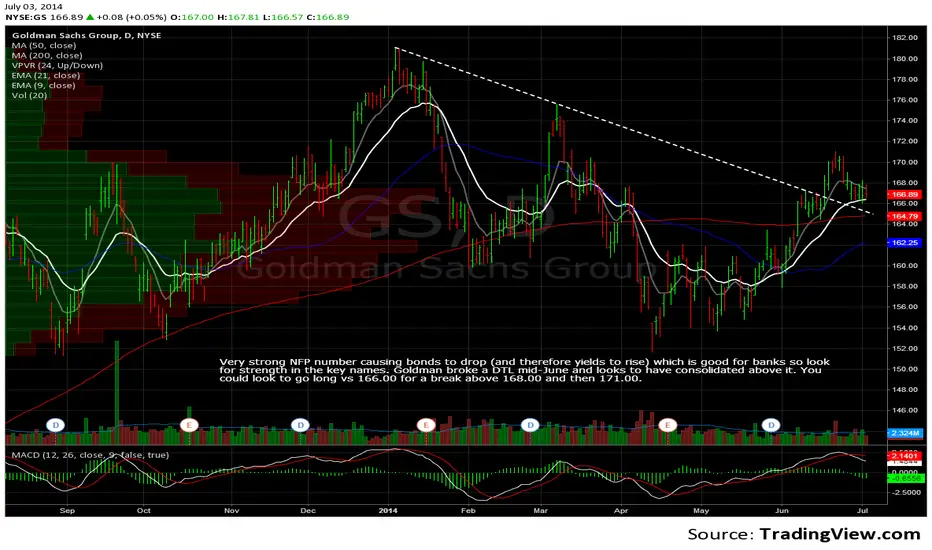
Failed to break out over 170 this weekMay try to go next week. If it fails again, expect weakness to 165


