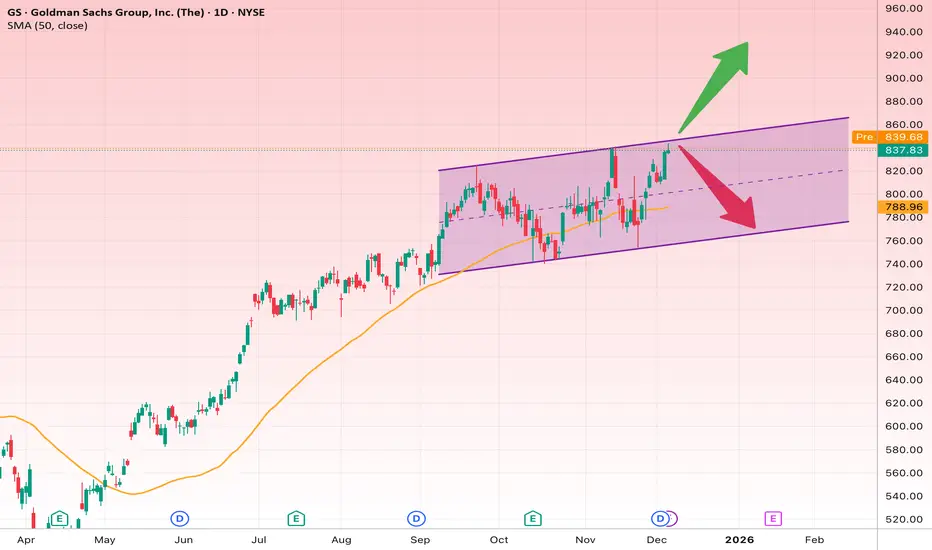
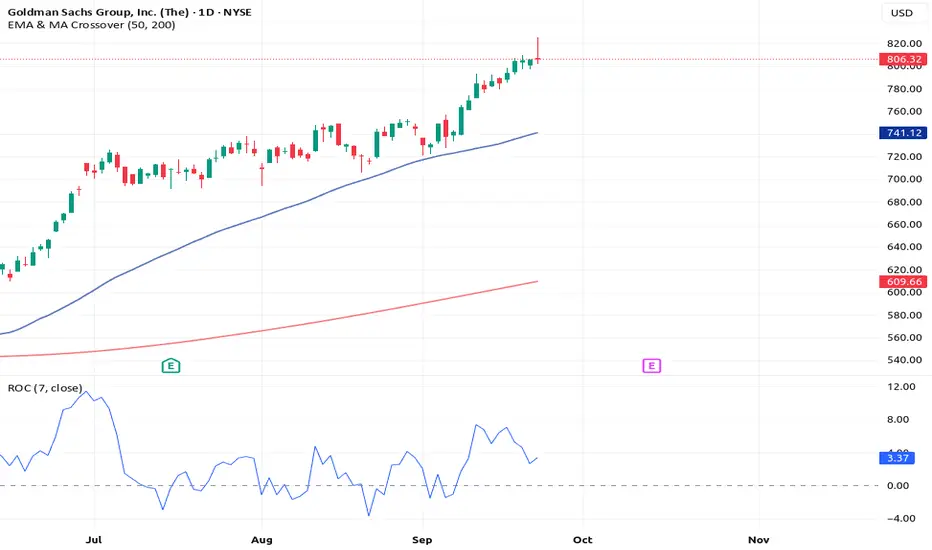
GS at the Edge: Breakout or Pullback?GS is currently moving inside a well-defined ascending channel and has once again reached the upper half of the channel, a key decision zone that will determine the next major move.
• Overall trend: Bullish
• Structure: Ascending channel + dynamic support from the 50-day SMA
• Current status: Tes
Key facts today
3.1 USD
12.68 B USD
112.65 B USD
About Goldman Sachs Group, Inc. (The)
Sector
Industry
CEO
David Michael Solomon
Website
Headquarters
New York
Founded
1869
ISIN
ARBCOM460119
The Goldman Sachs Group, Inc. engages in the provision of financial services. It operates through the following business segments: Global Banking and Markets, Asset and Wealth Management, and Platform Solutions. The Global Banking and Markets segment includes investment banking, global investments, and equity and debt investments. The Asset and Wealth Management segment relates to the direct-to-consumer banking business which includes lending, deposit-taking, and investing. The Platform Solutions segment includes consumer platforms such as partnerships offering credit cards and point-of-sale financing, and transaction banking. The company was founded by Marcus Goldman in 1869 and is headquartered in New York, NY.
Related stocks
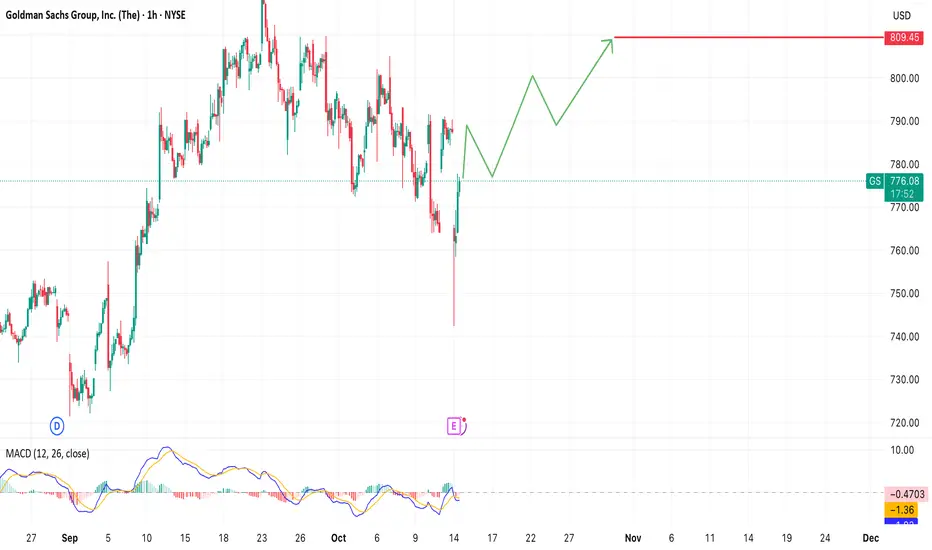
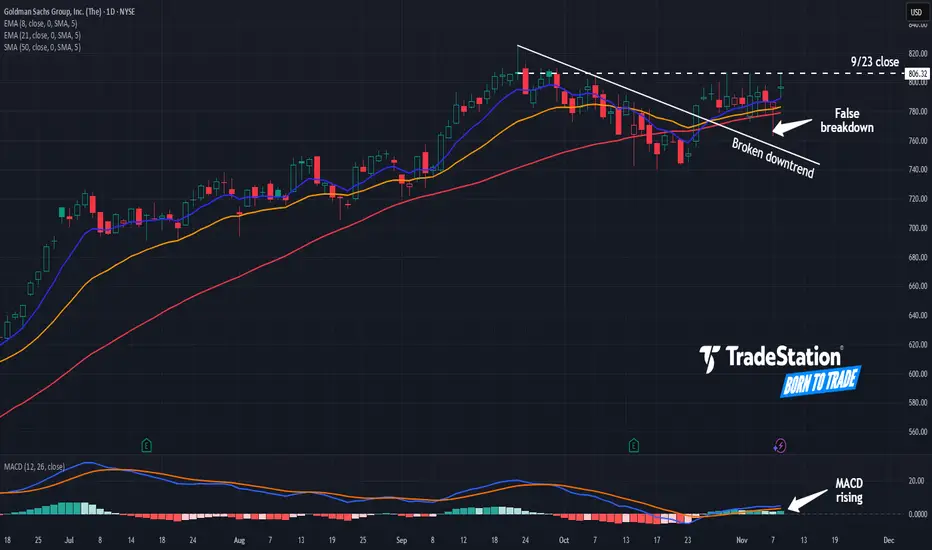
After a strong Q3 report — with Assets Under Management reachingFollowing its Q3 report with EPS of $12.25 (above expectations) and ~20% revenue growth, NYSE:GS shares held firm and began to recover.
Key levels:
Support: $760 – 765
Resistance / Target: $809 — previous profit-taking zone
MACD is showing signs of a bullish reversal
Price structure sugg
Goldman Sachs (NYSE: $GS) : $2B Innovator Deal Boosts ETF PowerGoldman Sachs (NYSE: NYSE:GS ) is taking a major leap in the fast-growing ETF market with its $2 billion acquisition of Innovator Capital Management. The deal brings in a powerful lineup of 161 U.S.-listed ETFs managing nearly $30 billion in assets, instantly strengthening Goldman’s position in def
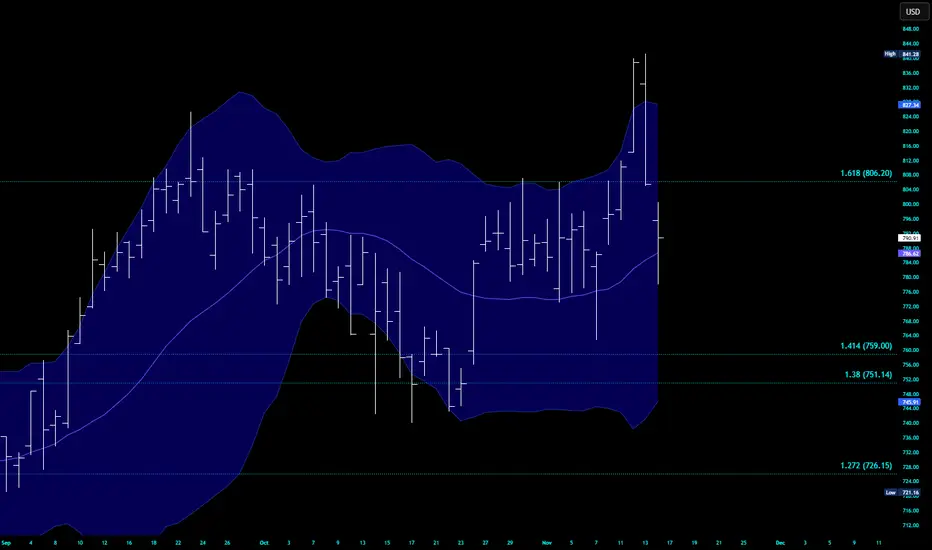
$GS daily outside reversal11/13/25 NYSE:GS posted a convincing "outside sell" aka "outside reversal down" aka bearish engulfing whatever you want to call it. Convenient location at the 1.618 ;)
Top signal
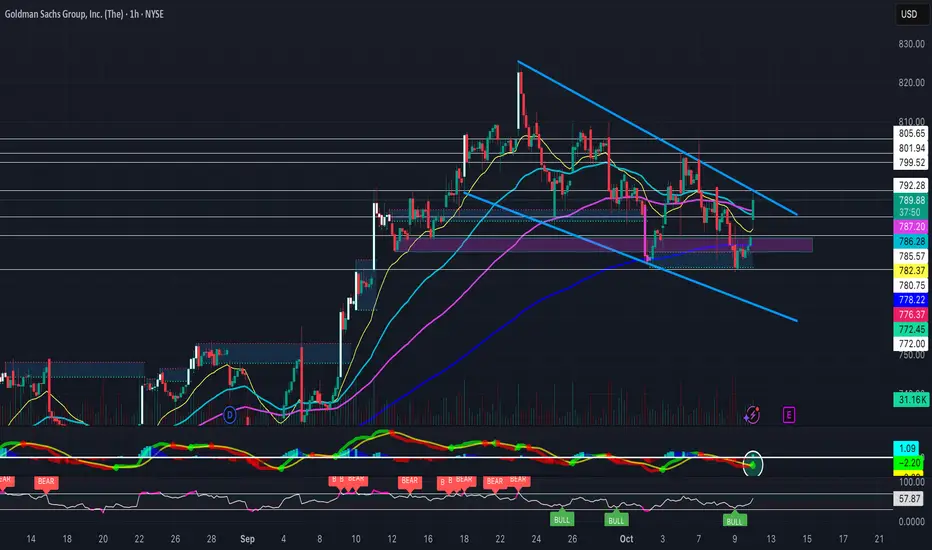
Is Goldman Going Higher?Goldman Sachs has gone seven weeks without a new high, but some traders may see further upside in the Wall Street giant.
The first pattern on today’s chart is the series of lower highs between late September and late October. GS has spent more than two weeks above that falling trendline, which may
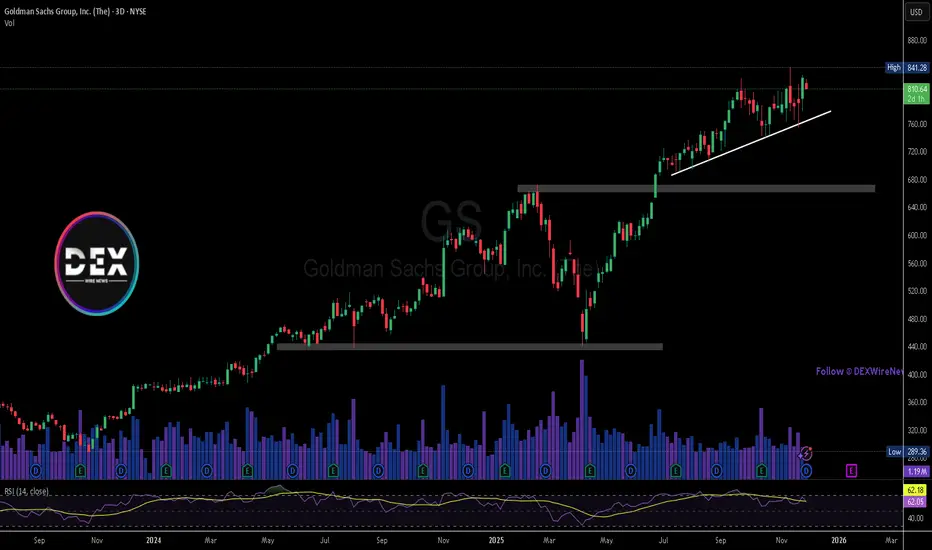
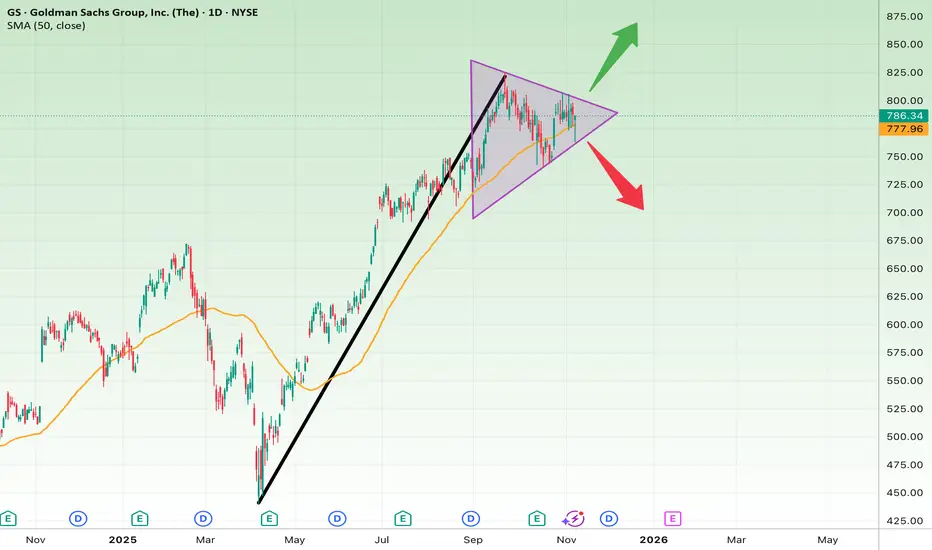
Calm Before the Storm for Goldman SachsAfter a strong rally from around $525 to near $820, GS has entered a symmetrical triangle consolidation pattern. This type of formation often signals that a major move is coming once the breakout direction is confirmed.
The 50-day SMA (currently around $778) is acting as dynamic support.
Short-Te
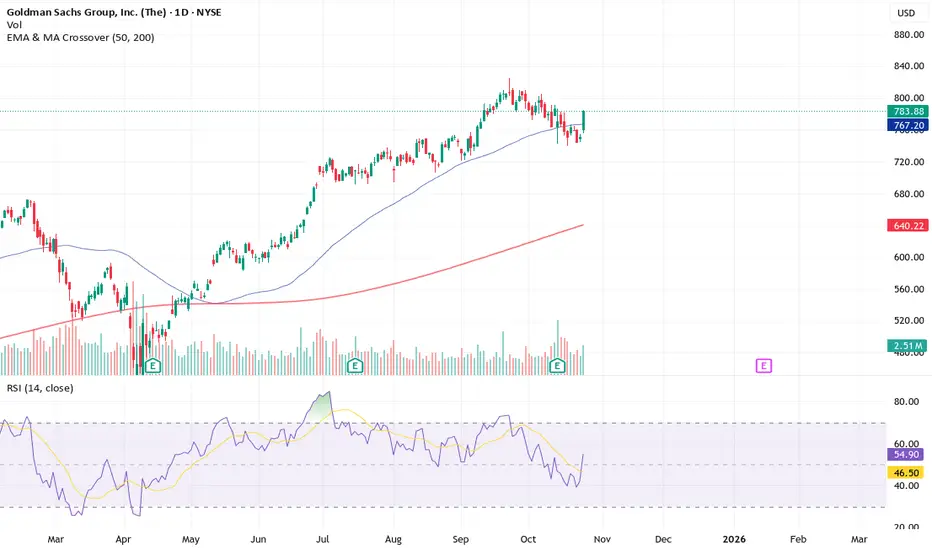
GS has broken down from a rising trendGS has broken down from a rising trend by 5% with increased volume.
The price has reached a green cloud in the Ichimoku indicator, but the last candlestick closes above the cloud. RSI21 is trending downward. To find proper support, one must look down around 670.
The banking sector can be somewhat cy

The 3-Step Rocket Booster Strategy Expanded EditionThis candlestick pattern looks like a shaven top,
with a small shadow at
the bottom.
You will also notice like the candle came from a reversal
pattern called the bullish harami.
This is then followed by rising window
which then moves into the Marabozu
white like candle stick pattern.
From seei
Falling Wedge Heading into EarningsAfter previously breaking out of a falling wedge to hit new ATH's, NYSE:GS is holding yet another falling wedge heading into earnings next week. (Previous Chart Below)
Its EMA's are curling upwards, some bullish hidden divergence on the RSI, a MACD golden cross, and a bullish FVG formed as suppor
The "Gravestone Doji" Is The #1 Chart PatternA long time ago i was talking to a friend
of mine over the phone.
He lives in Australia now.His father
had a high paying job.
Because of that his father
used his resources to help
his first born child
immigrate to a first world country.
This strategy is very common in the
upper middle class
a
See all ideas
Summarizing what the indicators are suggesting.
Oscillators
Neutral
SellBuy
Strong sellStrong buy
Strong sellSellNeutralBuyStrong buy
Oscillators
Neutral
SellBuy
Strong sellStrong buy
Strong sellSellNeutralBuyStrong buy
Summary
Neutral
SellBuy
Strong sellStrong buy
Strong sellSellNeutralBuyStrong buy
Summary
Neutral
SellBuy
Strong sellStrong buy
Strong sellSellNeutralBuyStrong buy
Summary
Neutral
SellBuy
Strong sellStrong buy
Strong sellSellNeutralBuyStrong buy
Moving Averages
Neutral
SellBuy
Strong sellStrong buy
Strong sellSellNeutralBuyStrong buy
Moving Averages
Neutral
SellBuy
Strong sellStrong buy
Strong sellSellNeutralBuyStrong buy
Displays a symbol's price movements over previous years to identify recurring trends.
FI4000513932
Goldman Sachs International 0.0% 02-AUG-2027Yield to maturity
94.19%
Maturity date
Aug 2, 2027
XS1610673003
Goldman Sachs Group, Inc. 4.17% 19-JUN-2028Yield to maturity
57.53%
Maturity date
Jun 19, 2028
XS1761617288
Goldman Sachs International 0.0% 25-APR-2028Yield to maturity
55.77%
Maturity date
Apr 25, 2028
XS1817577361
Goldman Sachs International 0.0% 23-MAY-2028Yield to maturity
45.14%
Maturity date
May 23, 2028
XS1610659358
Goldman Sachs Group, Inc. 22.799999% 01-DEC-2026Yield to maturity
39.42%
Maturity date
Dec 1, 2026
XS1610670322
Goldman Sachs Group, Inc. 0.0% 19-OCT-2027Yield to maturity
35.90%
Maturity date
Oct 19, 2027
G
XS1649999478
Goldman Sachs Finance Corporation International Ltd. 0.0% 19-OCT-2027Yield to maturity
35.76%
Maturity date
Oct 19, 2027
G
XS1841769711
Goldman Sachs Finance Corporation International Ltd. 0.0% 01-AUG-2028Yield to maturity
34.94%
Maturity date
Aug 1, 2028
See all GSC bonds
Curated watchlists where GSC is featured.


