Point and Figure price targets for $JD Based on horizontal and vertical count methods. Represents next continuous rise until a consolidation period.
Trade ideas

JD Review1. Extremely undervalued compared to other E-Commerce companies like PDD
2. Downtrend line and key resistance level breakout
3. U-shape reversing
4. JD Finance/Health/Express going IPO

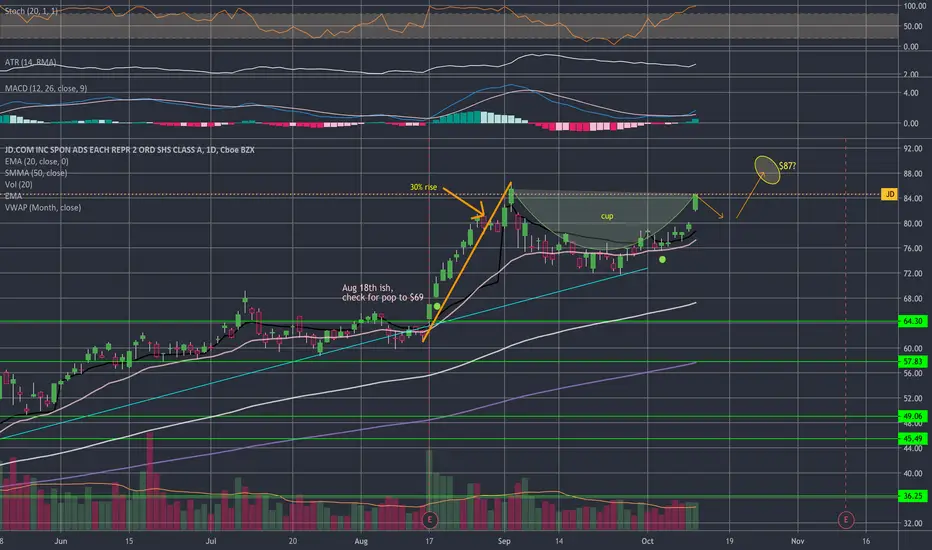
JD Support and Resistance- Potential Squeeze Oct 14Since curving down and bottoming at 71.76 NASDAQ:JD has moved back up along a similar curve. As long as this curve holds JD could push back above 79.27 resistance and with the right conditions it could jump from 80.70 to 85+. Something to consider on JD is the MACD reaching a buy signal and the last 5 days have been higher opens with a close lower than the open. If JD can't hold the curve and 77.30 support, price could test 75.53 support and continue to consolidate in that range for the near future.


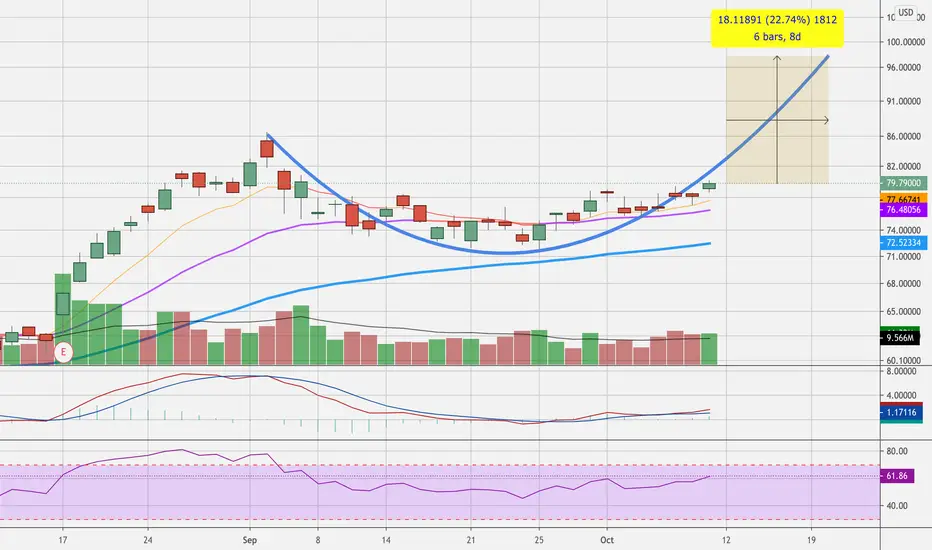
Bull FlagPossible T2 99.5 to 107
NV is high
Perhaps making another run for it
Not to long entry level today
Be safe
Not a recommendation

$JD Bullish Day Trade Targets
Potential day trade as JD may very well move in
sympathy with the ultra bullish BABA.
Targets $81.50 - $85.00

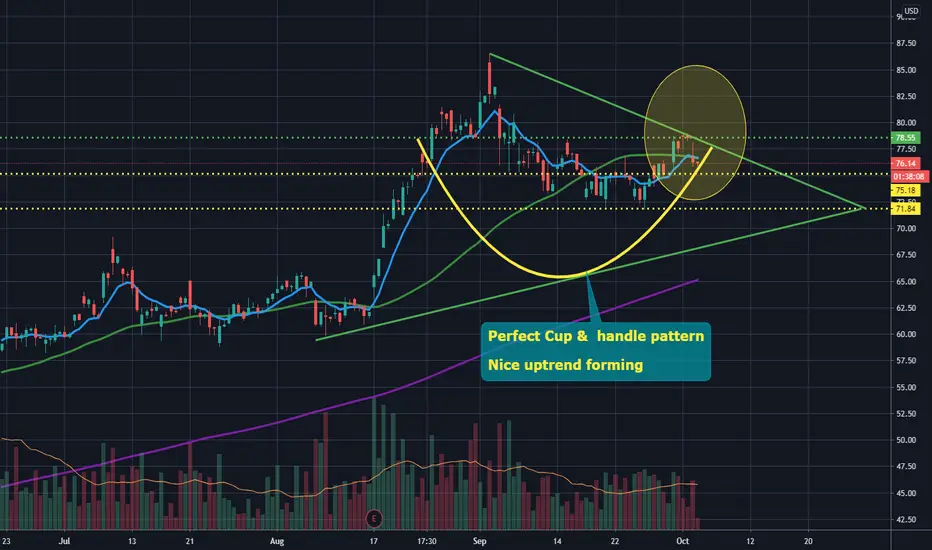
JD Long ideaAs I watch the markets moving higher, I think JD looks real good here. It's price is moving higher above the supporting moving averages. Swing Trade

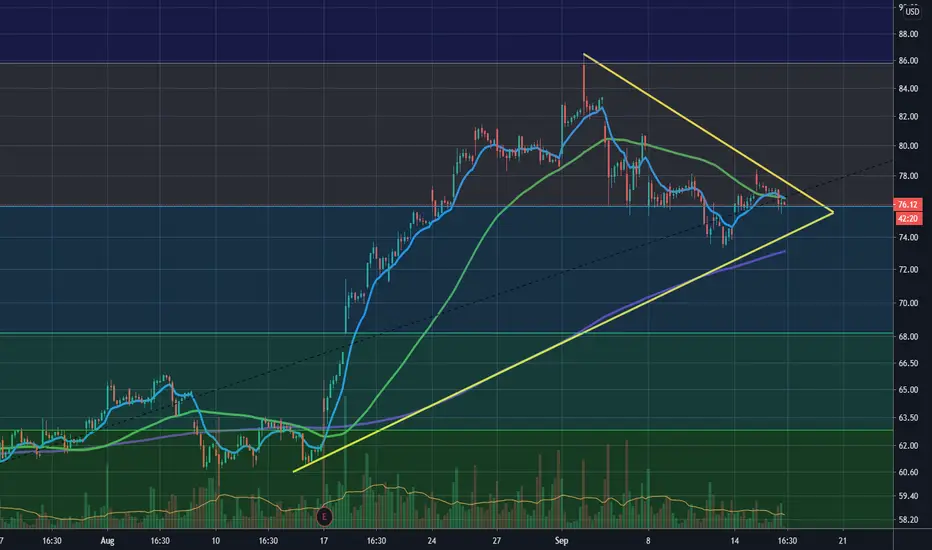
$JD Wedge Breakout Pull Back For Long Buyers$JD is forming a gorgeous wedge and is now attempting to pressure the top end (for the second time). If buyers can manage the run above wedge highs with conviction, there isn't much stopping the buyers from wanting a pullback to push higher again.


JD longResistances:
02/Sept aVWAP (top blue line)
Supports:
29/May aVWAP (bottom blue line)
Previous highs
bottom of Bullish Falling Wedges


9/22/2020 JDJD looks to have finished wave 3 and is entering Wave 4. I'm expecting a zig-zag or flat Wave 4 given the triangle Wave 2. Looking to build a position at 38.2%, and fully in at 50% and 61.8%.


JDIndicators:
wait 1 more dip before buying in is more safe:
4H
- MACD: Pushing up
- StochRSI: looking good
- RSI: slightly bullish divergence