JD - hourlyI like this on all time frames. This is based off the hourly coiled stochastic divergence and is a shorter term trade setup.
Buy: 44.00
Target: 44.55 - 46.25 (1.25% - 5.11%)
Stop: 43.50
Trade ideas

As using day trading process, two targets has approached I am so happy to notice, my JD short plan has approached. If you saw my analysis, and short at the position i draw on pic, congrats.


JD BreakoutJD has broken out of it's down trend. Confirmation will be if it impulses to the upside and does not slowly go back down.


JD in ABC correction? CCI / RSI gaave previous buy signals. However CCI is decreasing. Elliot Wave was quick and dirty (wave 3 isn't longest etc.). MACD buy signal could be false.
No position is taken yet.

JD longLong via Mar16 42/48 call spread for $2.36.
POP: 41%
Max Loss: $236
Stop Loss: Price at $42
Max profit: $364
Target: $48 (will peel off here)
long 42 call: 61 delta
short 48 call: 23 delta


JD: Long's VS Short's battle.A break to the upside will require people that are short to buyback their position and will trigger people to buy into it, same the other way.

JD DailyWow! If I could figure out the elliot wave or fib scripts... I'll take a wag and say just shy of $60 by March 1st. entry was a $41 on the descending wedge gap up. Added more on the breakout today at $49. fingers crossed


Bearish ButterflyJD, set other cancels other order for target/stop prices, still learning.
Target: 40.70
Stop: 46.70
Time Frame: 1st March


JD in Neutral.It is time to wait. During the 240 min graph, upper the red line placing the current price will be a absolutely bull, down under the blue line is bear

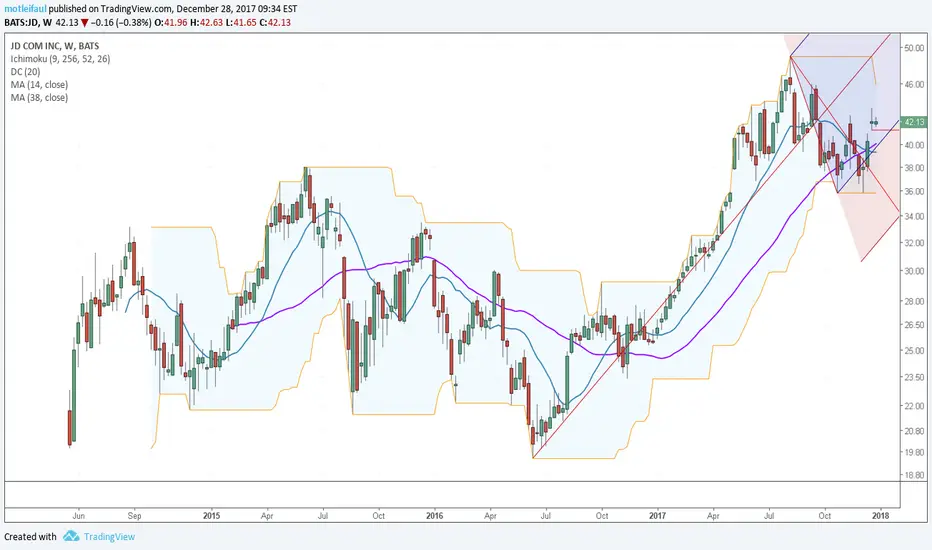
$JD: Nice Upside HereI think we have good odds to see this weekly forecast pan out. For e-commerce exposure, I favor this one personally.


JD looks good after break of flagJD could be a good long from here. If you want to be more cautious, then size in after it retest the trend line.

JD.com (JD) Falling Wedge Breakout Bull FlagJD looks like it may have a nice bull flag continuation after beginning a breakout from the falling wedge. Also has stochastic divergence on the weekly.
Buy: 40.83
Target: 42.39 - 43.95 (3.82% - 7.64%)

JD Short After a great earnings beat and seeing that the stock couldn't reach the 45-46 levels again, a formation of head and shoulders pattern is in the making; if it's true we would take profits with a short until 39,16. The stoch RSI confirms this idea located in an overbought zone.

JD Double Bottom?Watching JD for a possible double bottom here. Will look to enter on small pullback With stop just below bottoms
