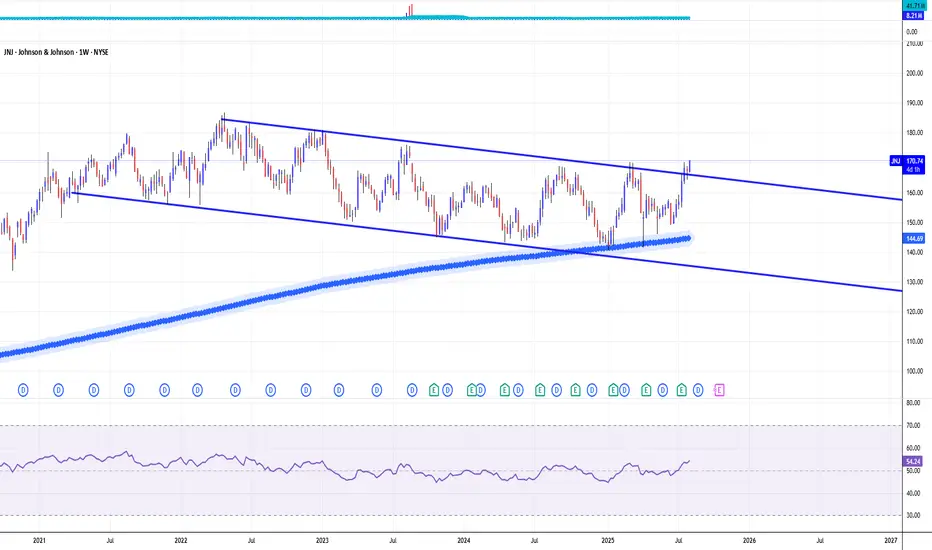
New Setup: JNJCoping with Market Cycles -- "We want to have more invested when the market rises than when it falls, and to own more of the things that rise more or fall less, and less of the others."
I'm liking JNJ because it's oversold and forming a tight wedge and price is being squeezed of the 20SMA. If the B
Johnson & Johnson Shs Cert Deposito Arg Repr 0.066666666 Shs
No trades
Key facts today
0.55 USD
12.49 B USD
78.89 B USD
About Johnson & Johnson
Sector
Industry
CEO
Joaquin Duato
Website
Headquarters
New Brunswick
Founded
1887
Identifiers
2
ISIN:ARDEUT110236
Johnson & Johnson is a holding company, which engages in the research, development, manufacture, and sale of products in the healthcare field. It operates through the Innovative Medicine and MedTech segments. The Innovative Medicine segment focuses on immunology, infectious diseases, neuroscience, oncology, cardiovascular and metabolism, and pulmonary hypertension. The MedTech segment includes a portfolio of products used in the interventional solutions, orthopaedics, surgery, and vision categories. The company was founded by Robert Wood Johnson I, James Wood Johnson, and Edward Mead Johnson Sr. in 1887 and is headquartered in New Brunswick, NJ.
Related stocks

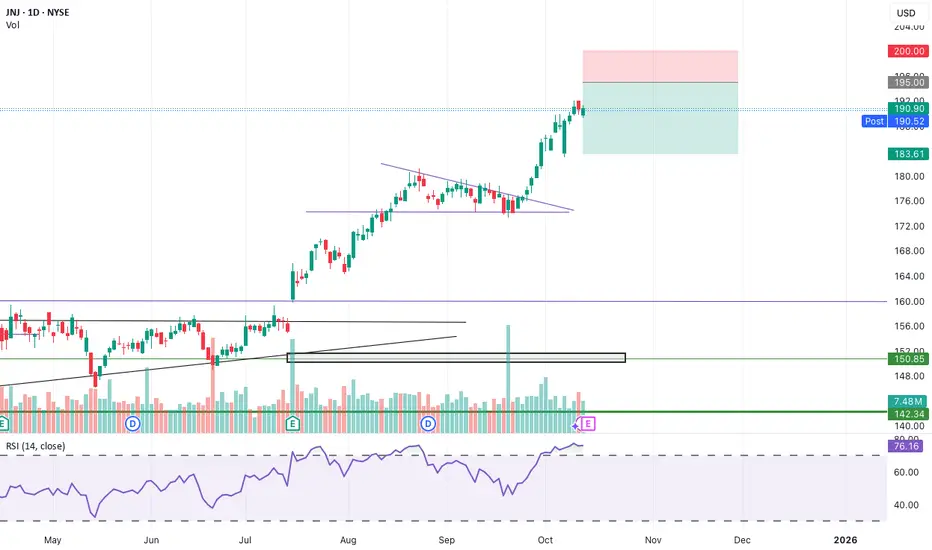
JNJ - Time To Lock In ProfitIs printing a shakeout that completes a double stab up slightly higher high (liquidity sweep)
And now a bearish impulsive candle is printing.
JNJ has been very strong, but I think this signals that one way or another there will be another wave down in the pipeline.
I'll be looking to pick this on

JOHNSON & JOHNSON Short-term correction ahead.Johnson & Johnson (JNJ) has been trading within a 5-month Channel Up since the June 20 Low, with the 1D MA50 (red trend-line) in firm Support.
The 4H RSI is printing a peak formation similar to all previous Higher Highs of the pattern. What followed after all those tops were pull-backs just under t

JNJ Price Target Summary (This Week)
Johnson & Johnson (JNJ) is currently trading around $204.
Analyst consensus price targets for the next 12 months are mostly in the $200–$207 range, with the highest targets around $230, but these are long-term estimates — not short-term.
A move to $228 this week is unlikely, as JNJ is a large, st

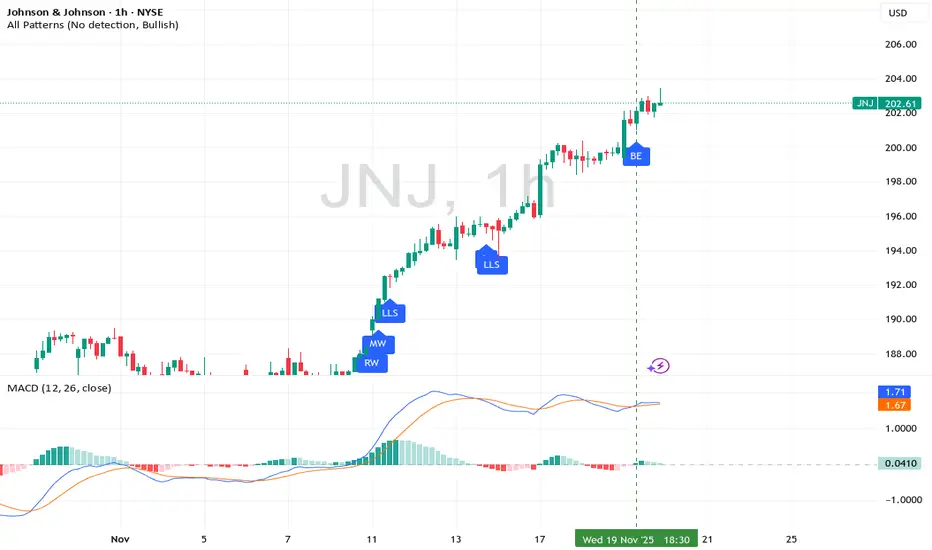
"On the 1 hour timeframe i looked for a candlestick pattern"I missed this entry on this stock NYSE:JNJ
but atleast i got to see the entry.
This entry happen,
On the 1 hour timeframe i looked for a candlestick pattern
to show me the bottom reversal
After seeing the candlestick in this case the
bullish engulfing
Showed me the bottom reversal
then Boom
t
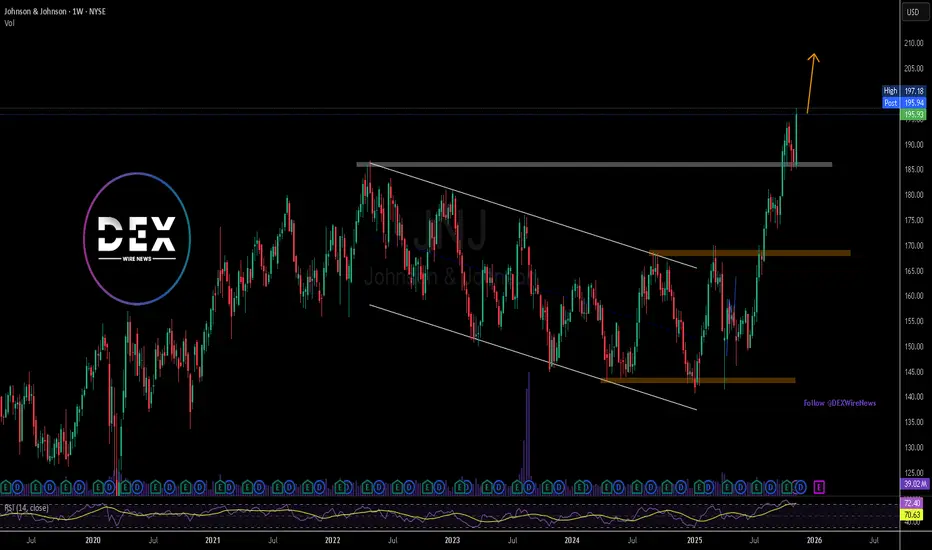
Johnson & Johnson (JNJ) Finds Support at Key Level Johnson & Johnson (JNJ) continues to demonstrate strong defensive positioning and renewed momentum as structural shifts in its business and improving sentiment fuel a breakout from a multiyear downtrend. After the successful separation of its consumer health arm, J&J is now more focused on its pharm
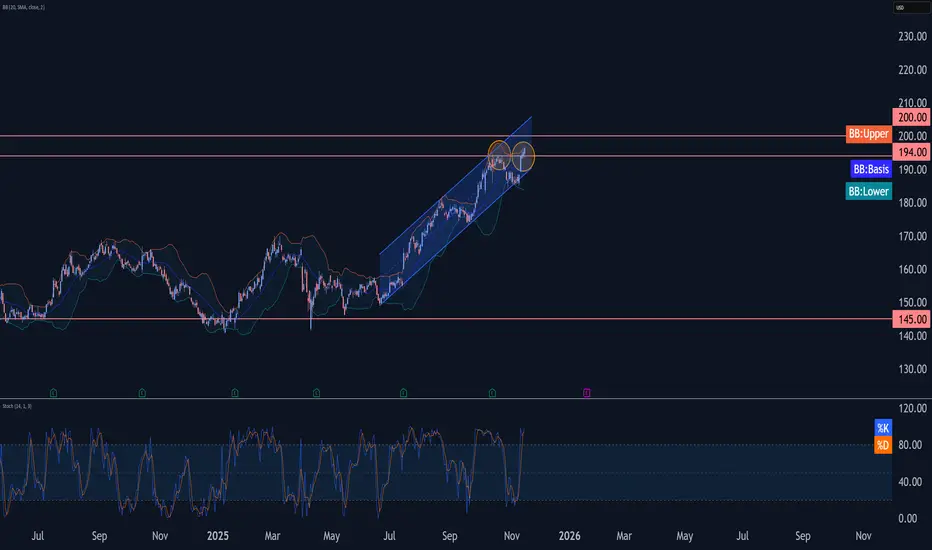
Johnson & Johnson Wave Analysis – 14 November 2025- Johnson & Johnson broke pivotal resistance level 194.00
- Likely to rise to resistance level 200.00
Johnson & Johnson recently broke above the pivotal resistance level 194.00, which stopped the previous impulse wave (3) in the middle of October.
The breakout of the resistance level 194.00 accel
Johnson & Johnson: Extended Wave 3 Nearing Completion, Watching Johnson & Johnson is showing a very nice recovery with clear impulsive price action since breaking out of the downward channel back in July. The structure suggests an ongoing trend with an extended black wave three that now has five waves up as expected, after a nice fourth wave retracement to 186 i

Bear Call Spread on JNJBear Call Spread Sell 195 Call strike and Buy 200 Call Strike, Exp: Nov 28 (45 DTE) for no less than $1.55
Trade has about 67% probability of profit
Taking advantage of high IV rank of 40
Credit received = $155
BP Effect = $345
Max Loss = (5 - 1.55) * 100 = $345
Breakeven = 195 + 1.55 = $196.55
Johnson & Johnson. Clean. Soft. Gentle. Growth.Johnson & Johnson (JNJ) stands out as a bellwether in the global healthcare sector, and its nearly 18% stock performance in 2025 reflects both robust fundamentals and compelling technical trends.
Fundamental Perspective
JNJ maintains a solid financial foundation, underpinned by consistently st
See all ideas
Summarizing what the indicators are suggesting.
Oscillators
Neutral
SellBuy
Strong sellStrong buy
Strong sellSellNeutralBuyStrong buy
Oscillators
Neutral
SellBuy
Strong sellStrong buy
Strong sellSellNeutralBuyStrong buy
Summary
Neutral
SellBuy
Strong sellStrong buy
Strong sellSellNeutralBuyStrong buy
Summary
Neutral
SellBuy
Strong sellStrong buy
Strong sellSellNeutralBuyStrong buy
Summary
Neutral
SellBuy
Strong sellStrong buy
Strong sellSellNeutralBuyStrong buy
Moving Averages
Neutral
SellBuy
Strong sellStrong buy
Strong sellSellNeutralBuyStrong buy
Moving Averages
Neutral
SellBuy
Strong sellStrong buy
Strong sellSellNeutralBuyStrong buy
Displays a symbol's price movements over previous years to identify recurring trends.
US478160CM4
Johnson & Johnson 3.5% 15-JAN-2048Yield to maturity
5.31%
Maturity date
Jan 15, 2048
JNJJ
Johnson & Johnson 3.75% 03-MAR-2047Yield to maturity
5.31%
Maturity date
Mar 3, 2047
US478160BV5
Johnson & Johnson 3.7% 01-MAR-2046Yield to maturity
5.28%
Maturity date
Mar 1, 2046
US478160CX0
Johnson & Johnson 5.25% 01-JUN-2054Yield to maturity
5.28%
Maturity date
Jun 1, 2054
US478160CT9
Johnson & Johnson 2.45% 01-SEP-2060Yield to maturity
5.22%
Maturity date
Sep 1, 2060
US478160CS1
Johnson & Johnson 2.25% 01-SEP-2050Yield to maturity
5.20%
Maturity date
Sep 1, 2050
JNJB
Johnson & Johnson 4.5% 05-DEC-2043Yield to maturity
5.15%
Maturity date
Dec 5, 2043
US478160BA1
Johnson & Johnson 4.85% 15-MAY-2041Yield to maturity
4.95%
Maturity date
May 15, 2041
US478160CR3
Johnson & Johnson 2.1% 01-SEP-2040Yield to maturity
4.94%
Maturity date
Sep 1, 2040
JNJ.GT
Johnson & Johnson 4.5% 01-SEP-2040Yield to maturity
4.77%
Maturity date
Sep 1, 2040
US478160CL6
Johnson & Johnson 3.4% 15-JAN-2038Yield to maturity
4.76%
Maturity date
Jan 15, 2038
See all JNJC bonds
Curated watchlists where JNJC is featured.


